. 2000 Nov 15;14(22):2881-92.
doi: 10.1101/gad.838900.

Preferential relaxation of positively supercoiled DNA by E. coli topoisomerase IV in single-molecule and ensemble measurements

Affiliations

Preferential relaxation of positively supercoiled DNA by E. coli topoisomerase IV in single-molecule and ensemble measurements

N J Crisona et al. Genes Dev. .

Abstract

We show that positively supercoiled [(+) SC] DNA is the preferred substrate for Escherichia coli topoisomerase IV (topo IV). We measured topo IV relaxation of (-) and (+) supercoils in real time on single, tethered DNA molecules to complement ensemble experiments. We find that the preference for (+) SC DNA is complete at low enzyme concentration. Otherwise, topo IV relaxed (+) supercoils at a 20-fold faster rate than (-) supercoils, due primarily to about a 10-fold increase in processivity with (+) SC DNA. The preferential cleavage of (+) SC DNA in a competition experiment showed that substrate discrimination can take place prior to strand passage in the presence or absence of ATP. We propose that topo IV discriminates between (-) and (+) supercoiled DNA by recognition of the geometry of (+) SC DNA. Our results explain how topo IV can rapidly remove (+) supercoils to support DNA replication without relaxing the essential (-) supercoils of the chromosome. They also show that the rate of supercoil relaxation by topo IV is several orders of magnitude faster than hitherto appreciated, so that a single enzyme may suffice at each replication fork.


Figures

Figure 1
Figure 1
Relaxation of (−) and (+) supercoiled DNA by topo IV. (A) Negatively (ς = −0.05) supercoiled (lanes 18) and (+) (ς = +0.035) supercoiled (lanes 916) 2.7-kb DNAs were incubated with the indicated molar ratios (top) of topo IV to DNA. The reacted DNA was analyzed by agarose gel electrophoresis, and autoradiograms of Southern blots of the gels are shown. The positions of nicked (N), relaxed (R), and supercoiled (SC) DNA for the first two panels are indicated. In the panel at right, reactions shown in lanes 18 were analyzed on a gel containing 1 μg/mL chloroquine to resolve the topoisomers. Relaxation, which results in a shift in the distribution of topoisomers and the appearance of new bands, is first detected in lane 5. (B) Quantification of the data from the left and middle panels in A. The percent of relaxed DNA was calculated from the disappearance of DNA from the supercoiled band. (C) Three DNA substrates of different ς values were reacted with topo IV and relaxation evaluated by agarose gel electrophoresis in the absence (ς = +0.035) or presence (ς = −0.03 and −0.05) of 1 μg/mL chloroquine. The ΔLk was calculated as described in Materials and Methods. (D) Negatively supercoiled 2.7-kb (ς = −0.05) and (+) SC 3.5-kb (ς ∼ +0.05) DNAs were mixed and reacted with increasing amounts of topo IV. An autoradiogram of a Southern blot of the portion of the agarose gel containing the supercoiled substrates is shown. (E) Quantification of the data from D measured by the disappearance of DNA from the supercoiled bands.
Figure 2
Figure 2
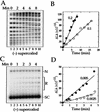
Kinetics of relaxation of (−) and (+) supercoiled DNA by topo IV. (A) Negatively supercoiled 2.7-kb DNA (ς = −0.05) was reacted at a molar ratio of 0.2 topo IV/DNA, and samples were removed at one-min intervals. Relaxation was analyzed by electrophoresis through an agarose gel containing 1 μg/mL chloroquine. An autoradiograph of a Southern blot of the gel is shown. (B) Quantification of relaxation of the (−) SC substrate at molar ratios of 0.1 (○) and 0.2 (●) topo IV/DNA. The rates of relaxation were one strand passage/enzyme/min at both stoichiometries. Negative supercoils were removed at a lower stoichiometry than in Fig. 1, because the DNA concentration was fivefold higher. (C) Positively SC 2.7-kb DNA (ς ∼ +0.05) was reacted with topo IV at a stoichiometry of 0.0025 and samples were removed at 30-sec intervals. Relaxation was analyzed by agarose gel electrophoresis. An autoradiograph of a Southern blot of the gel is shown. The positions of nicked DNA (N), relaxed topoisomers (R), and (+) supercoiled DNA (SC) are indicated. (D) Quantification of the data for relaxation of the (+) supercoiled substrate at stoichiometries of 0.0025 (○) and 0.005 (●). The rates of relaxation were 19 and 29 strand passages/enzyme/min at stoichiometries of 0.0025 and 0.005, respectively.
Figure 3
Figure 3
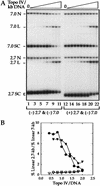
Competition between (−) and (+) supercoiled DNAs for cleavage by topo IV. (A) Equal amounts of 2.7- and 7-kb plasmids were incubated with ATP and increasing amounts of topo IV in the presence of norfloxacin to trap enzyme–DNA cleavage complexes. After addition of SDS and deproteinization, the reacted DNA was analyzed by agarose gel electrophoresis in buffer containing ethidium bromide. An autoradiograph of a Southern blot of the gel is shown. Cleavage was measured by the percent of the DNA in linear form. In lanes 111, both the 2.7-kb (ς = −0.05) and the 7-kb DNAs were (−) supercoiled. The percent linear DNA in lane 6, for example, was 1.8 for the 2.7-kb DNA and 4.0 for the 7-kb DNA. In lanes 1222, the 2.7-kb DNA was (+) supercoiled (ς = +0.035) and the 7-kb DNA was (−) supercoiled. The percent linear DNA in lane 17 was 8.7 for the 2.7-kb and 2.4 for the 7-kb DNA. The position of nicked (N), linear (L), and supercoiled (SC) DNA for each substrate is indicated. The number of molecules of topo IV per kilobase of DNA ranged from ∼0.1–0.8. (B) Quantification of the competition cleavage data for reactions carried out in the presence or absence of ATP, expressed as the ratio of cleaved 2.7-kb to cleaved 7-kb substrate. For comparison with other experiments, the topo IV/DNA ratios are based on all of the DNA being 2.7 kb. (+) SC 2.7-kb DNA and (−) SC 7-kb DNA with (●) and without (▾) ATP; (−) SC 2.7-kb and (−) SC 7-kb DNA with (○) and without (▿) ATP.
Figure 4
Figure 4
Relaxation of a single supercoiled DNA molecule by topo IV. (A) Schematic of the experimental system. Here the tethered DNA is stretched by a weak force (F = 0.2 pN) and plectonemic supercoils are generated by rotating the magnets (designated N and S) above the bead. Enzyme-mediated relaxation of supercoils is monitored by measuring the change in extension, l, of the DNA. (B) DNA extension as a function of added supercoils. When the magnets are rotated counterclockwise or clockwise, (+) or (−) supercoils, respectively, are added to the DNA molecule, and its extension changes. The raw data (distance of the bead from the surface in successive video frames) are given in magenta and the filtered data as a blue line. After 40 counterclockwise turns of the magnets, the DNA molecule is (+) supercoiled at time 0. As the magnets are rotated clockwise, (+) supercoils are removed and the extension of the DNA increases. Then, as (−) supercoils are added, the DNA shortens. For the force and ionic conditions used here, a change in extension of 0.12 μm corresponds to two supercoils added or removed. (C) Positive supercoils but not (−) supercoils are relaxed at low enzyme concentration, a Sisyphean effect. At time zero, the reaction mixture contained 50 ng/mL topo IV, 1 mM ATP, and relaxed DNA. When the magnets were rotated counterclockwise (0 to ∼70 sec) to introduce (+) supercoils, the extension of the molecule did not change, indicating that topo IV was relaxing the supercoils as fast as the magnets could add them. When the magnets were rotated clockwise (−) supercoils accumulated (120–190 sec), and the DNA extension decreased, as if no enzyme were present. The black lines indicate steps of five turns.
Figure 5
Figure 5
Single-molecule measurements of the rate of (+) and (−) supercoil relaxation by topo IV. For all panels, the raw data are given in magenta and the filtered data (A,B,D,E) in blue. The raw data were filtered at 0.2 Hz in A, D, and E, and at 0.8 Hz in B. The best fit lines to the data in C and E are in black. (A) Relaxation of (+) supercoils by 10 ng/mL topo IV was monitored by the change in the DNA extension. Arrows pointing down indicate the start of mechanical overwinding of the DNA to ς = +0.03 (30 turns), and arrows pointing up show the initiation of relaxation. A long waiting time (Twait) between the introduction of supercoils and the onset of relaxation is indicated. (B) Relaxation of (+) supercoiling in two bursts, separated by a small pause located between the vertical black lines. Such small pauses were edited out from the data shown in C. (C) Composite data of 15 bursts of (+) supercoil relaxation, totaling about 140 enzymatic cycles, are plotted. The best linear fit to the data yields the rate of supercoil removal of 180 strand passages/min. In this analysis, waiting times and pauses longer than the relaxation time were removed (Strick et al. 2000). (D) Relaxation of (−) supercoils by topo IV. The DNA at time zero was negatively supercoiled to ς = −0.035, and relaxation by 200 ng/mL topo IV was monitored as in A. Four cycles of (−) supercoiling followed by relaxation are shown. The horizontal arrows show the change in extension corresponding to a ΔLk of +2, a single enzyme turnover. (E) Blow-up of the last relaxation event in D. (F) Composite data of ten bursts of relaxation of (−) supercoils, totaling ∼80 enzymatic cycles, are shown. The slope of the best fit line yields the rate of supercoil removal of eight strand passages/min. In this analysis, waiting times and pauses were not removed as they are not clearly differentiated from the slow relaxation events.
Figure 6
Figure 6
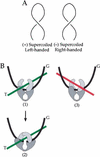
Model for the differential binding of topo IV to (+) and (−) supercoiled DNA. (A) Both positively (left) and negatively (right) plectonemic supercoiled DNAs have sharply bent apical regions and antiparallel crossings of the DNA but different local DNA geometry. The superhelix of (+) SC DNA is left-handed, whereas that of (−) SC DNA is right-handed. (B) Topo IV is depicted as a clamp-like structure by analogy to yeast topo II (Berger et al. 1996). The black line represents the G segment, which is bent as a consequence of topo IV binding. (1) When the DNA is (+) SC, a second DNA segment binds properly as the T segment (green line) in a left-handed relationship to the G segment. (2) The proper binding of the G and T segments allows cleavage of the G segment to take place. (3) When the DNA is (−) SC, the second segment (red line) is at the wrong angle relative to the G segment to bind properly as the T segment. However, there is an interaction between the second segment and the enzyme that stabilizes the complex, but in a nonproductive way.

Similar articles

Cited by

References

    1. Baird CL, Harkins TT, Morris SK, Lindsley JE. Topoisomerase II drives DNA transport by Hydrolyzing one ATP. Proc Natl Acad Sci. 1999;96:13685–13690. - PMC - PubMed
    1. Benjamin HW, Cozzarelli NR. Geometric arrangements of Tn3 resolvase sites. J Biol Chem. 1990;265:6441–6447. - PubMed
    1. Berger JM, Gamblin SJ, Harrison SC, Wang JC. Structure and mechanism of DNA topoisomerase II. Nature. 1996;379:225–232. - PubMed
    1. Bird R, Lark K. Chromosome replication in Escherichia coli 15T– at different growth rates: Rate of replication of the chromosome and the rate of formation of small pieces. J Mol Biol. 1970;49:343–366. - PubMed
    1. Boocock MR, Brown JL, Sherratt DJ. Topological specificity in Tn3 resolvase catalysis. In: McMacken R, Kelly TJ, editors. DNA replication and recombination. Vol. 47. New York: Alan R. Liss; 1987. pp. 703–718.

Publication types

LinkOut - more resources