. 2000 Dec;20(23):8933-43.
doi: 10.1128/MCB.20.23.8933-8943.2000.

Functional interaction between nucleosome assembly proteins and p300/CREB-binding protein family coactivators

Affiliations

Functional interaction between nucleosome assembly proteins and p300/CREB-binding protein family coactivators

N Shikama et al. Mol Cell Biol. 2000 Dec.

Abstract

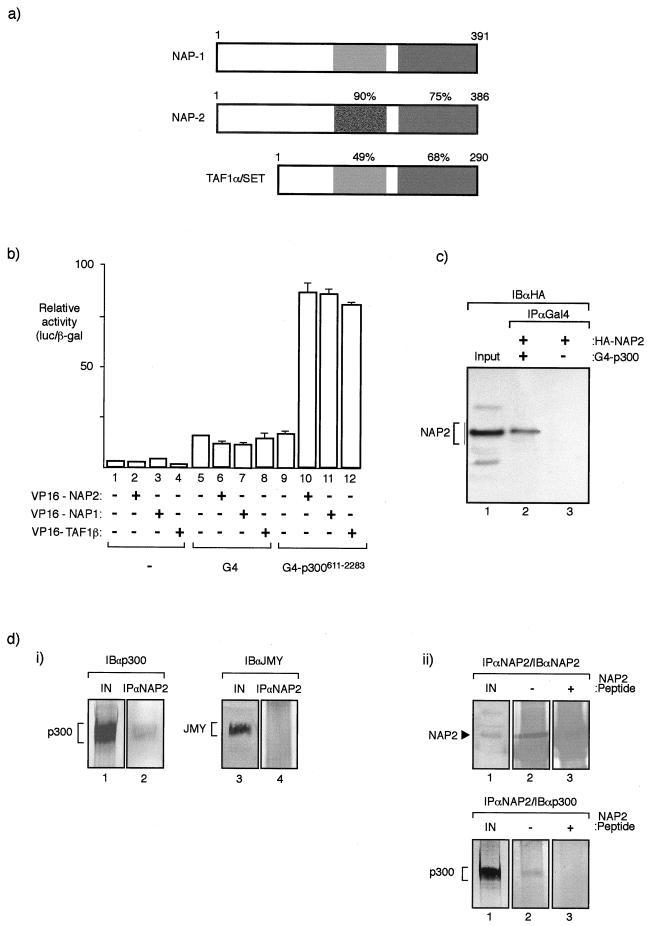
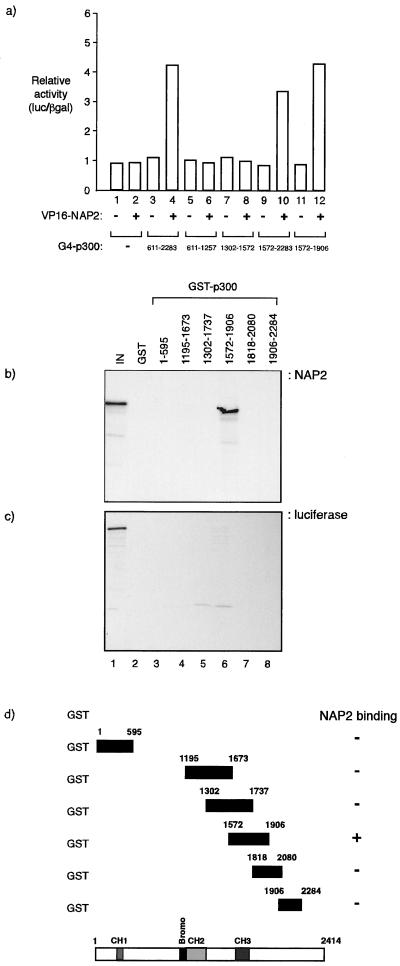
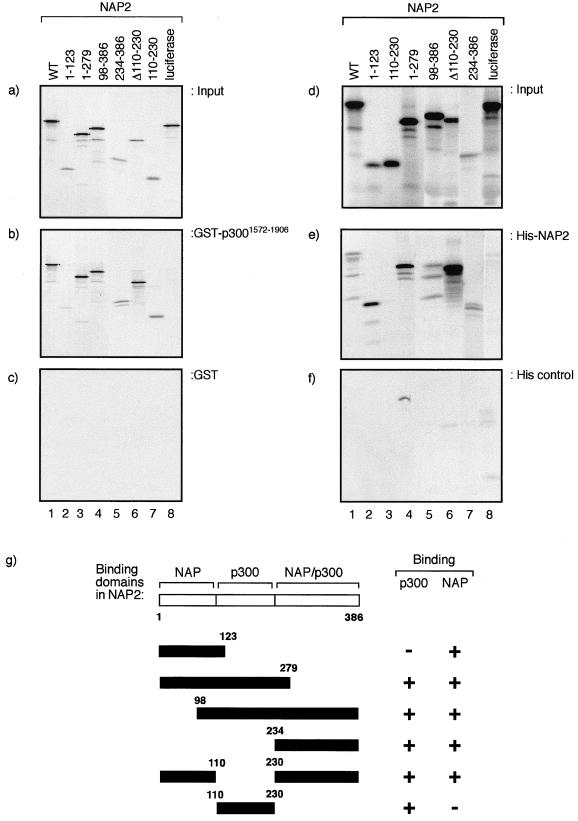
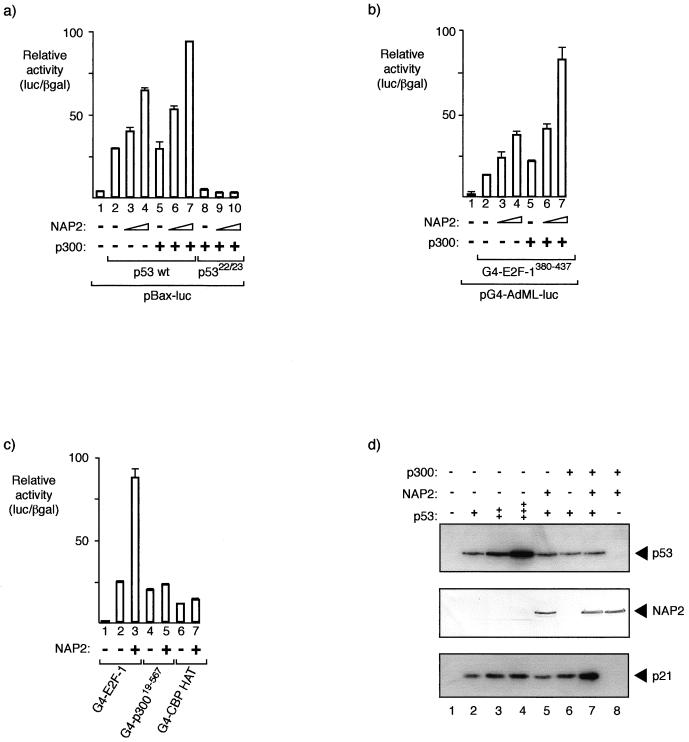
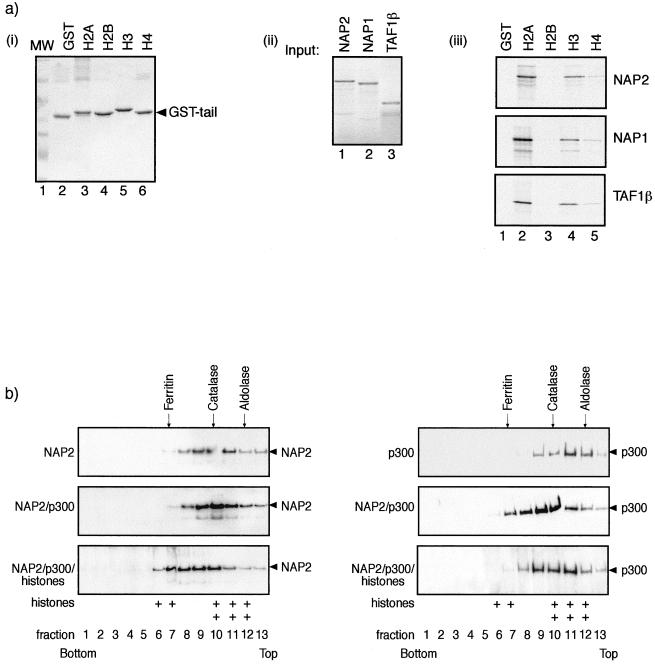
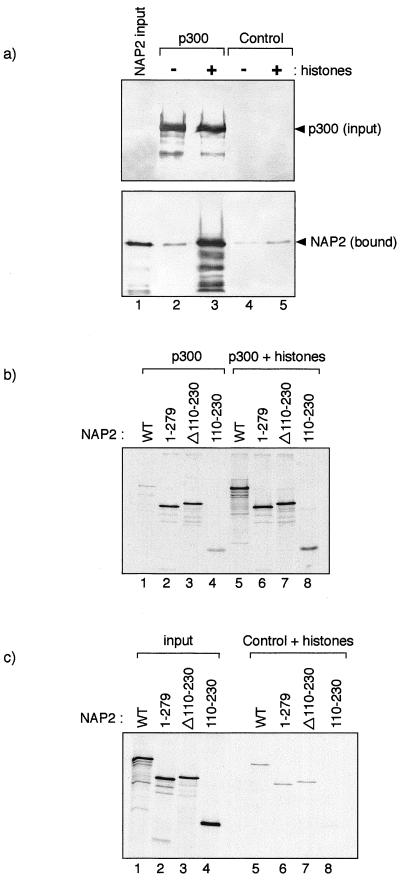
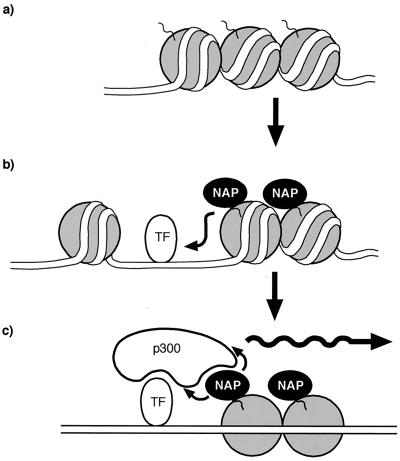
The p300/CREB-binding protein (CBP) family of proteins consists of coactivators that influence the activity of a wide variety of transcription factors. Although the mechanisms that allow p300/CBP proteins to achieve transcriptional control are not clear, it is believed that the regulation of chromatin is an important aspect of the process. Here, we describe a new level of p300-dependent control mediated through the functional interaction between p300/CBP and members of the family of nucleosome assembly proteins (NAP), which includes NAP1, NAP2, and TAF1. We find that NAP proteins, which have previously been implicated in the regulation of transcription factor binding to chromatin, augment the activity of different p300 targets, including p53 and E2F, through a process that is likely to involve the physical interaction between p300 and NAP. NAP proteins can form oligomers, and the results show that NAP proteins can bind to both core histones and p300 coactivator proteins, perhaps in a multicomponent ternary complex. We also provide data in support of the idea that histones can influence the interaction between p300 and NAP protein. These results argue that NAP is a functionally important component of the p300 coactivator complex and suggest that NAP may serve as a point of integration between transcriptional coactivators and chromatin.


Figures

FIG. 1
FIG. 1
NAP proteins interact with p300. (a) Diagrammatic summary of members of the NAP family (NAP1, NAP2, and TAF1α) and the level of similarity between each human protein. The protein regions were compared with NAP2 from residue 159 to 270 and residue 337 to 382. The corresponding regions in NAP1 were 167 to 278 and 344 to 387, and in TAF they were 91 to 189 and 243 to 288. It should be noted that TAF1α and TAF1β are proteins that arise through alternative splicing and differ in a region in the N-terminal domain (42). (b) Mammalian two-hybrid assay performed in U2OS cells where the indicated VP16-NAP or TAF1β expression vectors (0.5 μg) were transfected together with expression vectors encoding G4 or pG4-p300611–2283 (0.5 μg). The values shown represent the average of three separate readings and the ratio of luciferase derived from the reporter pG4-luc and the internal control pCMV-βgal. (c) Coimmunoprecipitation of NAP2 and p300 hybrid proteins from U2OS cells transfected with pG4-p300611–2283 (lane 2) or pG4 (lane 3) together with pCMV-HA-NAP2 (lanes 1, 2, and 3). After extraction, immunoprecipitation was performed with anti-Gal4 antibody (IPαGal4) followed by immunoblotting with anti-HA (12CA5) (IBαHA). An extract from cells transfected with HA-NAP2 is shown in lane 1. (d) Panel i, coimmunoprecipitation of endogenous NAP2 and p300 from murine A31 cell extracts was performed using anti-NAP2 peptide antiserum followed by immunoblotting with either anti-p300 (lane 2) or, as a control, anti-JMY (lane 4). Lanes 1 and 3 show the input extract. Note that p300, but not JMY (47), is present in the NAP2 immunoprecipitate and further that A31 cell extracts were used because the anti-NAP2 antibody recognizes murine NAP2 only. Panel ii, coimmunoprecipitation of endogenous NAP2 and p300 from A31 cells was performed using anti-NAP2 peptide antiserum in the presence (+) (lane 3) or absence (−) (lane 2) of homologous peptide followed by immunoblotting with either anti-NAP2 (top) or anti-p300 (bottom). Lane 1 shows the input extract, and NAP2 and p300 are indicated. Note that the NAP2 polypeptide is absent in the presence of the competing NAP2 peptide (+) (top) and that p300 in the immunoprecipitate correlates with the presence of NAP2 (bottom).
FIG. 2
FIG. 2
NAP proteins bind to p300. (a) A mammalian two-hybrid assay was performed with U2OS cells transfected with the indicated expression vectors, VP16 or VP16-NAP2 (0.5 μg), together with pG4, pG4-p300611–2283, pG4- p300611–1257, pG4-p3001302–1572, pG4-p3001572–2283, or pG41572–1906 (0.5 μg). The values shown are derived from triplicate readings (luciferase/β-galactosidase ratio [luc/βgal]) and represent the fold increase in the presence of VP16-NAP2 relative to VP16 alone. (b, c, and d) Binding assay between the indicated GST-p300 fusion proteins and in vitro-translated NAP2 (b) or luciferase (c) in which about 5.0 μg of GST fusion protein was incubated with the in vitro translate. Lane 1 shows the input (10%) NAP2 (b) or luciferase (c). Panel d shows a summary of the data, together with the location of the relevant domains in p300.
FIG. 3
FIG. 3
Domains in NAP2 that interact with p300 and NAP proteins form dimers. (a, b, and c) The indicated regions of NAP2 were in vitro translated (a) and assessed for binding to GST-p3001572–1906 (about 5 μg) (b) or GST alone (about 5 μg) (c). (d, e, and f) The indicated regions of NAP2 were in vitro translated (d) and assessed for binding to His-NAP2 (about 5 μg) (e) or His control beads (f). Note that the His control beads (f) were treated with bacterial extract without NAP2 induction. (g) Summary of the binding domains in NAP2 for p300 and NAP proteins.
FIG. 4
FIG. 4
NAP proteins augment the p300-dependent transcription factors p53 and E2F-1. (a) The p53 reporter pBax-luc (0.5 μg) together with expression vectors for wild-type p53 (50 ng), p5322/23 (50 ng), p300 (3 μg), or NAP2 (2 or 5 μg) was introduced into SAOS2 cells as indicated. The values shown are the average of duplicate readings and represent the ratio of the level of luciferase to the β-galactosidase activity from the internal control. (b) The Gal4 reporter pG4-AdML-luc (0.5 μg) together with expression vectors for Gal4-E2F-1380–437 (50 ng), p300 (+ indicates 4 μg), or NAP2 (2 or 4 μg) was introduced into SAOS2 cells as indicated, and the luciferase/β-galactosidase ratio was calculated as described above. (c) The Gal4 reporter pG4-AdML-luc (0.5 μg) together with expression vectors for Gal4-E2F-1380–437 (50 ng), Gal4-p30019–567 (50 ng), or Gal4-CBP HAT (50 ng) and NAP2 (+ indicates 4 μg) was introduced into SAOS2 cells as indicated, and the luciferase/β-galactosidase ratio was calculated as described above. (d) Regulation of endogenous p21Waf1/Cip1 levels by NAP2 and p300. The indicated plasmids were transfected into SAOS2 cells (p53, 0.3, 1.0, and 2.0 μg; NAP2 and p300, 5 μg), and the transfected cells were harvested at 48 h. Cell extracts were immunoblotted with anti-p53 (DO-1), anti-NAP2 peptide antiserum, or anti-p21 (C19).
FIG. 5
FIG. 5
NAP2 binds to core histones. (a) Panel i, about 1 μg of GST (lane 2), GST-H2A (lane 3), H2B (lane 4), H3 (lane 5), or H6 (lane 6) N-terminal tail fusion proteins was stained by Coomassie blue. Lane 1 shows the molecular weight standards. Panel ii, in vitro-translated NAP2 (lane 1), NAP1 (lane 2), and TAF1β (lane 3) showing 10% of the input used for panel iii. Panel iii, binding between in vitro-translated NAP2 (top), NAP1 (middle), or TAF1β (bottom) and the indicated GST proteins. Note that upon longer exposure, specific binding was apparent between the NAP proteins and H2B and H4 tails. (b) Sucrose gradient analysis was performed as described previously on either NAP2 alone, NAP2 and p300, or NAP2, p300, and core histones, using 2 μg of each pure protein preparation or 4 μg of core histones. Samples were subjected to 20 to 50% sucrose gradient centrifugation, and fractions were analyzed by SDS-PAGE and immunoblotted with anti-NAP2, anti-p300, or anti-H2A-H2B. Note that when NAP2, p300, and core histones were analyzed together, the extent of sedimentation increased. The distribution of core histones H2A-H2B in fractions 6, 7, and 8 in the NAP2-p300-histone gradient (bottom) is indicated by +; in the absence of all three proteins, histones appeared predominantly in fractions 10, 11, and 12. The positions of the standard molecular masses of aldolase (158 kDa), catalase (232 kDa), and ferritin (440 kDa) are shown. Wild-type His-NAP2 and Flag-p3001135–2414 were used in the analysis.
FIG. 6
FIG. 6
Binding of NAP to p300 is augmented in the presence of core histones. (a) Flag-tagged p300 (1135 to 2414; about 1 μg) was incubated with His-NAP2 (about 1 μg) in the presence (about 3 μg; indicated by +) (lane 3) or absence (−) (lane 2) of chicken core histones. Control Flag-tagged beads were treated in a similar fashion (lanes 4 and 5), and lane 1 represents the input (10%) NAP2 protein. Note that in the presence of core histones, the level of NAP2 associated with p300 is substantially increased and that the effect seen on the control Flag-tagged beads is far less dramatic. (b and c) The indicated NAP2 mutant derivatives were in vitro translated, and the binding to wild-type Flag-tagged p300 (about 1 μg) was assessed in the absence (b) (lanes 1 to 4) or presence (b) (lanes 5 to 8) of core histones (about 5 μg). The effect of histones on the binding to the NAP2 derivatives to control Flag beads is shown (c) (lanes 5 to 8); the input protein (10%) is shown in lanes 1 to 4. Note that the data shown in panels b and c were derived from the same experiment and represent similar exposure times and that the specific effect of histones on the interaction between NAP2 and p300 can be seen by comparing lanes 5 in panels b and c.
FIG. 7
FIG. 7
Hypothetical model for NAP-dependent stimulation of p300 transcription. (a) Nucleosomal DNA is shown, which upon interacting with NAP (indicated by the arrow) facilitates the binding of transcription factors to their DNA binding site in a nucleosomal template (b). The recruitment and binding of p300 coactivators by the activation domains of sequence-specific transcription factors are strengthened through the interaction of p300 with NAP (c), which is suggested to augment transcriptional activation.

Similar articles

Cited by

References

    1. Adams C R, Kamakaka R T. Chromatin assembly: biochemical identities and genetic redundancy. Curr Opin Genet Dev. 1999;9:185–190. - PubMed
    1. Anzick S L, Kononen J, Walker R L, Azorsa D O, Tanner M M, Guan X Y, Sauter G, Kallioniemi O P, Trent J M, Meltzer P S. AIB1, a steroid receptor coactivator amplified in breast and ovarian cancer. Science. 1997;277:965–968. - PubMed
    1. Armstrong J A, Emerson B M. Transcription of chromatin: these are complex times. Curr Opin Genet Dev. 1998;8:165–172. - PubMed
    1. Avantaggiati M L, Ogryzko V V, Gardner K, Giordano A, Levine A S, Kelly K. Recruitment of p300/CBP in p53-dependent signal pathways. Cell. 1997;89:1175–1184. - PubMed
    1. Bannister A J, Kouzarides T. The CBP co-activator is a histone acetyltransferase. Nature. 1996;384:641–643. - PubMed

Publication types

MeSH terms