. 2000 Dec;74(23):10965-74.
doi: 10.1128/jvi.74.23.10965-10974.2000.

Retroviral cDNA integration: stimulation by HMG I family proteins

Affiliations

Retroviral cDNA integration: stimulation by HMG I family proteins

L Li et al. J Virol. 2000 Dec.

Abstract

To replicate, a retrovirus must synthesize a cDNA copy of the viral RNA genome and integrate that cDNA into a chromosome of the host. We have investigated the role of a host cell cofactor, HMG I(Y) protein, in integration of human immunodeficiency virus type 1 (HIV-1) and Moloney murine leukemia virus (MoMLV) cDNA. Previously we reported that HMG I(Y) cofractionates with HIV-1 preintegration complexes (PICs) isolated from freshly infected cells. PICs depleted of required components by treatment with high concentrations of salt could be reconstituted by addition of purified HMG I(Y) in vitro. Here we report studies using immunoprecipitation that indicate that HMG I(Y) is associated with MoMLV preintegration complexes. In mechanistic studies, we show for both HIV-1 and MoMLV that each HMG I(Y) monomer must contain multiple DNA binding domains to stimulate integration by HMG I(Y)-depleted PICs. We also find that HMG I(Y) can condense model HIV-1 or MoMLV cDNA in vitro as measured by stimulation of intermolecular ligation. This reaction, like reconstitution of integration, depends on the presence of multiple DNA binding domains in each HMG I(Y) monomer. These data suggest that binding of multivalent HMG I(Y) monomers to multiple cDNA sites compacts retroviral cDNA, thereby promoting formation of active integrase-cDNA complexes.


Figures
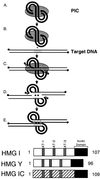
FIG. 1
FIG. 1
(Top) Diagram of the integration pathway. The HIV cDNA is shown by the thick lines, and proteins of the PIC are shown by the gray shading. Target DNA is shown by the thin lines. DNA 5′ ends are marked with solid circles. Note that product D corresponds to the integration intermediate marked “II” in later figures. (Bottom) HMG I family proteins. The conserved A/T hook DNA binding domains are shown in gray, and the acidic C-terminal domains are shown in black.
FIG. 2
FIG. 2
Immunoprecipitation (IP) of active PICs with antigen affinity-purified antibodies against HMG I(Y). Partially purified or salt-stripped PICs were immunoprecipitated with the indicated antibodies and protein A/G beads. Integration reactions were carried out with PICs bound to beads. The cDNA arrows mark the unreacted cDNA. II, integration intermediate. (A) IP with antibodies against MoMLV integrase. Lane 1, IP with preimmune serum; lane 2, IP with affinity-purified anti-integrase antibody (α- IN). (B) IP with HMG I(Y) antibody. Lane 1, IP with preimmune serum; lane 2, IP with anti-HMG I(Y) antibody; lane 3, IP with anti-HMG I(Y) antibody and free HMG I(Y) added as a competitor. (C) Salt stripping blocks immunoprecipitation with the anti-HMG I(Y) antibody. Lane 1, IP of partially purified PICs with anti-HMG I(Y) antibody; lane 2, IP of salt-stripped PICs with anti-HMG I(Y) antibody. Note that the production of the circular autointegration product seen in subsequent figures is a consequence of salt stripping and so is absent here. Characterization of the structures of integration products can be found in references , , , , and .
FIG. 3
FIG. 3
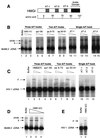
Reconstitution of integration activity with HMG I(Y) deletion derivatives and HMG I-C. (A) Diagram of HMG I illustrating the locations of breakpoints studied. (B) Reconstitution of salt-stripped MoMLV PICs with deletion derivatives of HMG I(Y) proteins. Integration was carried out in vitro and analyzed on Southern blots probed with a labeled MoMLV LTR. HMG I(Y) derivatives used for reconstitution are indicated above the autoradiograms. II, integration intermediate produced by integration in vitro; circle, autointegration product; cDNA, unreacted viral DNA; aa, amino acids. Triangles above the lane indicate 1 or 0.2 μg was added. Lanes: 1, no added protein; 2 to 3, reconstitution with full-length HMG I; 4 and 5, reconstitution with an HMG I(Y) derivative lacking the acidic C-terminal domain; 6 to 9, reconstitution with HMG I(Y) derivatives containing two A/T hooks; 10 to l5, reconstitution with single A/T hooks. Molarities for 1 μg in 100-μl reaction mixtures were as follows: full-length HMG I(Y), 0.85 μM; 1–90, 1 μM; 9–75, 1.25 μM; 50–91, 2 μM; AT-1, 4.7 μM; AT-2, 4.7μM; and AT-3, 5 μM. (C) Reconstitution of salt-stripped HIV-1 PICs with deletion derivatives of HMG I(Y). Assay and labeling are as in panel B, except that the triangles indicate 5 or 1 μg was added. The assays of single A/T hooks contained 5 μg. (D and E) Reconstitution of MoMLV PICs (D) and HIV-1 PICs (E) with HMG I-C. The amounts added were 5, 1, or 0.2 μg for MoMLV or 5 μg for HIV-1.
FIG. 4
FIG. 4
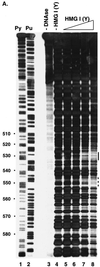
Analysis of binding of HMG I(Y) to the HIV-1 LTR. (A) Analysis by DNase I protection. A restriction fragment containing sequences 295 to 634 from the HIV-1 LTR was labeled with 32P on the 5′ end at an artificial NdeI site at the U5 edge of the LTR. Lanes: 1, cleavage at pyrimidine (Py) residues; 2, cleavage at purine (Pu) residues; 3, uncleaved DNA; 4 to 9, 0.1 U of DNase I per ml; 4, no added HMG I(Y); 5, 0.8 nM HMG I(Y); 6, 2 nM HMG I(Y); 7, 7 nM HMG I(Y); 8, 22 nM HMG I(Y). (B) Oligonucleotide probes used in the gel retardation assay. The wild-type probe corresponds to residues 404 to 467 of the HIV LTR (NL4-3, left LTR). MUT, mutant; sub, substitution. (C) Gel retardation analysis of binding to the wild-type probe by HMG I or HMG Y. The mobilities of the free probe and observed complexes are indicated beside the gel. Lanes 1 to 5 contained the following concentrations of HMG I: 1, 0.13 nM; 2, 0.8 nM; 3, 4 nM; 4, 20 nM; 5, 100 nM. Lanes 6 to 9 contained the following concentrations of HMG Y: 6, 0.8 nM; 7, 4 nM; 8, 20 nM; 9, 100 nM. (D) Rescue of binding to mutant sites by inosine substitution. The DNA substrates studied are marked above the gel. W.T., wild type. Lanes 1 to 7, no added protein; lanes 8 to 14, 1 nM HMG I.
FIG. 4
FIG. 4
Analysis of binding of HMG I(Y) to the HIV-1 LTR. (A) Analysis by DNase I protection. A restriction fragment containing sequences 295 to 634 from the HIV-1 LTR was labeled with 32P on the 5′ end at an artificial NdeI site at the U5 edge of the LTR. Lanes: 1, cleavage at pyrimidine (Py) residues; 2, cleavage at purine (Pu) residues; 3, uncleaved DNA; 4 to 9, 0.1 U of DNase I per ml; 4, no added HMG I(Y); 5, 0.8 nM HMG I(Y); 6, 2 nM HMG I(Y); 7, 7 nM HMG I(Y); 8, 22 nM HMG I(Y). (B) Oligonucleotide probes used in the gel retardation assay. The wild-type probe corresponds to residues 404 to 467 of the HIV LTR (NL4-3, left LTR). MUT, mutant; sub, substitution. (C) Gel retardation analysis of binding to the wild-type probe by HMG I or HMG Y. The mobilities of the free probe and observed complexes are indicated beside the gel. Lanes 1 to 5 contained the following concentrations of HMG I: 1, 0.13 nM; 2, 0.8 nM; 3, 4 nM; 4, 20 nM; 5, 100 nM. Lanes 6 to 9 contained the following concentrations of HMG Y: 6, 0.8 nM; 7, 4 nM; 8, 20 nM; 9, 100 nM. (D) Rescue of binding to mutant sites by inosine substitution. The DNA substrates studied are marked above the gel. W.T., wild type. Lanes 1 to 7, no added protein; lanes 8 to 14, 1 nM HMG I.
FIG. 5
FIG. 5
DNA ligation promoted by HMG I(Y) and deletion derivatives. The HMG I proteins used in ligation reactions are as indicated above the gels (designations as in Fig. 3). LTR, the end-labeled DNA substrate matching a single LTR DNA. (A) HIV-1 LTR. (B) MoMLV LTR. The time of ligation is indicated in minutes above the gel. Lanes: 1 to 5, no HMG I; 6 to 10, 1 μM HMG I(Y); 11 to 15, 1.5 μM HMG I(Y) 9–75; 16 to 20, 1.5 μM HMG I(Y) 50–91; 21 to 25, 3 μM AT-1; 26 to 30, 3 μM AT-2; 31 to 35, 3 μM AT-3. Concentrations were adjusted to maintain the same molarity of A/T hook DNA binding domains.

Similar articles

Cited by

References

    1. Aiyar A, Hindmarsh P, Skalka A M, Leis J. Concerted integration of linear retroviral DNA by the avian sarcoma virus integrase in vitro: dependence on both long terminal repeat termini. J Virol. 1996;70:3571–3580. - PMC - PubMed
    1. Brown P O, Bowerman B, Varmus H E, Bishop J M. Correct integration of retroviral DNA in vitro. Cell. 1987;49:347–356. - PubMed
    1. Brown P O, Bowerman B, Varmus H E, Bishop J M. Retroviral integration: structure of the initial covalent complex and its precursor, and a role for the viral IN protein. Proc Natl Acad Sci USA. 1989;86:2525–2529. - PMC - PubMed
    1. Bukrinsky M I, Sharova N, McDonald T L, Pushkarskaya T, Tarpley G W, Stevenson M. Association of integrase, matrix, and reverse transcriptase antigens of human immunodeficiency virus type 1 with viral nucleic acids following acute infection. Proc Natl Acad Sci USA. 1993;90:6125–6129. - PMC - PubMed
    1. Bushman F D, Craigie R. Activities of human immunodeficiency virus (HIV) integration protein in vitro: specific cleavage and integration of HIV DNA. Proc Natl Acad Sci USA. 1991;88:1339–1343. - PMC - PubMed

Publication types

MeSH terms

LinkOut - more resources