. 2000 Sep;124(1):135-51.
doi: 10.1104/pp.124.1.135.

Redistribution of Golgi stacks and other organelles during mitosis and cytokinesis in plant cells

Affiliations

Redistribution of Golgi stacks and other organelles during mitosis and cytokinesis in plant cells

A Nebenführ et al. Plant Physiol. 2000 Sep.

Abstract

We have followed the redistribution of Golgi stacks during mitosis and cytokinesis in living tobacco BY-2 suspension culture cells by means of a green fluorescent protein-tagged soybean alpha-1,2 mannosidase, and correlated the findings to cytoskeletal rearrangements and to the redistribution of endoplasmic reticulum, mitochondria, and plastids. In preparation for cell division, when the general streaming of Golgi stacks stops, about one-third of the peripheral Golgi stacks redistributes to the perinuclear cytoplasm, the phragmosome, thereby reversing the ratio of interior to cortical Golgi from 2:3 to 3:2. During metaphase, approximately 20% of all Golgi stacks aggregate in the immediate vicinity of the mitotic spindle and a similar number becomes concentrated in an equatorial region under the plasma membrane. This latter localization, the "Golgi belt," accurately predicts the future site of cell division, and thus forms a novel marker for this region after the disassembly of the preprophase band. During telophase and cytokinesis, many Golgi stacks redistribute around the phragmoplast where the cell plate is formed. At the end of cytokinesis, the daughter cells have very similar Golgi stack densities. The sites of preferential Golgi stack localization are specific for this organelle and largely exclude mitochondria and plastids, although some mitochondria can approach the phragmoplast. This segregation of organelles is first observed in metaphase and persists until completion of cytokinesis. Maintenance of the distinct localizations does not depend on intact actin filaments or microtubules, although the mitotic spindle appears to play a major role in organizing the organelle distribution patterns. The redistribution of Golgi stacks during mitosis and cytokinesis is consistent with the hypothesis that Golgi stacks are repositioned to ensure equal partitioning between daughter cells as well as rapid cell plate assembly.


Figures
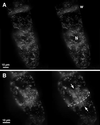
Figure 1
Figure 1
Stereo images showing the Golgi stack distribution in a living tobacco BY-2 cells in interphase (A) and metaphase (B). A, Interphase cell. Projections of 30 individual deconvolved epifluorescence images taken at 1-μm intervals. N, Nucleus; w, cell wall. B, Metaphase cell. Projections of a three-dimensional reconstruction derived from 60 individual deconvolved epifluorescence images taken at 0.5-μm intervals. Arrows denote the location of the spindle poles. The dashed line traces an equatorial accumulation of Golgi stacks, the “Golgi belt”. Animated three-dimensional reconstructions of these cells can be viewed at http://mcdb.colorado.edu/~nebenfue/cytokinesis.
Figure 2
Figure 2
Golgi stack density in different regions of the cytoplasm in interphase (black bars) and metaphase cells (gray bars). Total numbers of Golgi stacks were determined with an automated peak-finding algorithm. Cytoplasmic volume in manually delineated regions of the cells was defined as the area covered by the combined GFP and MitoTracker fluorescence, i.e. the part of the cytosol accessible to larger organelles. Golgi stack density is given as number of stacks per picoliter of cytoplasm. Error bars represent the se (n = 3). Note the much higher density of Golgi stacks in the immediate vicinity of the spindle in metaphase cells.
Figure 3
Figure 3
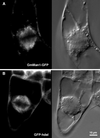
Comparison of GmMan1-GFP (A) and GFP-hdel (B) fluorescence in metaphase cells. On the left are fluorescence images and on the right corresponding differential interference contrast (DIC) image of the same cells. A, BY-2 cell expressing GmMan1-GFP. Note the presence of hazy, string-like fluorescence in the mitotic spindle in addition to the punctate appearance of Golgi stacks. B, BY-2 cell expressing ER-targeted GFP (GFP-hdel). A similar hazy fluorescence pattern is seen in the spindle.
Figure 4
Figure 4
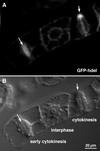
Distribution of ER in interphase and cytokinetic in GFP-hdel expressing BY-2 cells. A, Fluorescence image showing the distribution of the GFP-hdel marker. B, DIC image of the same group of cells. The left cell is in telophase/early cytokinesis with a prominent phragmoplast between the daughter nuclei. The right cell is in a later stage of cytokinesis with a phragmoplast near to top edge of the cell. The central cell is in interphase. Arrows point at the forming cell plates within the phragmoplasts. The strong GFP-hdel fluorescence within the phragmoplasts reveals the abundance of ER in this region. Note the change in ER distribution between interphase and cytokinesis. The strong labeling of cortical cytoplasm and transvacuolar strands during interphase is nearly absent in dividing cells.
Figure 5
Figure 5
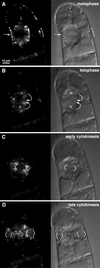
Time-lapse observation of Golgi stack distribution in a dividing BY-2 cell. Fluorescence (left) and DIC images (right) were taken in close succession at various time points during mitosis and cytokinesis. A, Metaphase. Arrow denotes plane of metaphase plate of chromosomes. Bracket indicates the position of the “Golgi belt” in the cortical cytoplasm. B, Telophase. The daughter nuclei (N) have moved out to the spindle poles and Golgi stacks are seen entering the internuclear region (arrows). C, Early cytokinesis. The phragmoplast (angle brackets) has formed between the daughter nuclei. Golgi stacks are excluded from the phragmoplast but accumulate in its vicinity. D, Late cytokinesis. The phragmoplast (angle brackets) has grown centrifugally and has almost reached the parental plasma membrane. Golgi stacks, but not ER, continue to be excluded from the phragmoplast but are present in close proximity. Note the presence of Golgi stacks close to the more mature cell plate in the center of the cell. A time-lapse video sequence of this cytokinesis can be viewed at http://mcdb.colorado.edu/∼nebenfue/cytokinesis.
Figure 6
Figure 6
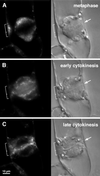
Time-lapse series demonstrating that the Golgi belt predicts the site of cell plate fusion with the plasma membrane. Fluorescence images (left) and DIC images (right) of a BY-2 cell with a slanted metaphase plate, taken at metaphase (A), telophase/early cytokinesis (B), and late cytokinesis (C). Note that the early cell plate appears in the same plane as the metaphase plate (arrows). Later the left end of the phragmoplast curves upwards toward an area of Golgi stack accumulation, the Golgi belt (bracket).
Figure 7
Figure 7
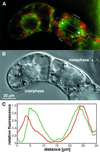
Comparison of fluorescence distribution for Golgi stacks/ER and mitochondria/plastids in adjacent interphase and metaphase cells. A, Merged fluorescence image showing Golgi stacks and ER in green and mitochondria and plastids (labeled with MitoTracker) in red. The stars denote the positions of the spindle poles. The brackets mark the region of the Golgi belt. B, DIC image of the same cells in interphase (left, note nucleolus) and metaphase (right, note metaphase plate), respectively.
Figure 8
Figure 8
Comparison of Golgi stack and ER (green) distribution with that of mitochondria and plastids (red) at various points during mitosis and cytokinesis. Each row shows from left to right green fluorescence channel, red fluorescence channel, merged fluorescence images, and DIC images. A, Metaphase; B, early cytokinesis; and C, late cytokinesis (same cell as in B). Brackets delineate the Golgi belt at metaphase. Arrows point at the growing ends of the cell plate. Note that in this case the late cell plate (C) curves upward toward regions that were rich in Golgi stacks earlier (B). N, Nucleus; p, plastid; m, mitochondrion.
Figure 9
Figure 9
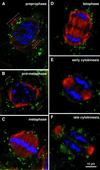
Golgi stack distribution relative to MTs. MTs (red) were detected in fixed BY-2 cells by indirect immunofluorescence. DNA (blue) was marked with DAPI, and Golgi stacks are green. A, Preprophase. Note the condensing chromosomes and the broad PPB of MTs (brackets). No particular arrangement of Golgi stacks can be discerned. B, Pro-metaphase. Chromosomes are fully condensed. The spindle is forming and the PPB (brackets) has almost disappeared. Golgi stacks show some accumulation near spindle poles and PPB/Golgi belt. C, Metaphase. Spindle is fully formed and chromosomes are arranged in metaphase plate. Golgi stacks are accumulated at spindle poles; the Golgi belt is not visible in this cell. D, Telophase. Chromosomes have moved to spindle poles and phragmoplast is starting to form in the interchromosomal region. Few Golgi stacks can be found between the MTs. E, Early cytokinesis. The phragmoplast has mostly disappeared from the center, allowing a few Golgi stacks into the internuclear region. F, Late cytokinesis. The phragmoplast has almost reached the plasma membrane. Golgi stacks are present close to the phragmoplast as well as surrounding the daughter nuclei.
Figure 10
Figure 10
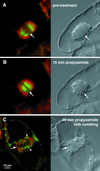
Effect of MT-disrupting drugs on organelle distribution. A and B, Individual BY-2 cell in metaphase before (A) and after a 15-min treatment with 10 μm propyzamide (B). The cell was treated in a perfusion chamber on the microscope stage. Arrow denotes the plane of the metaphase plate of chromosomes. Note the separation of Golgi and ER (green) and mitochondria and plastids (red) that is maintained even after the spindle has partially collapsed. C, BY-2 cell at metaphase that has been treated with 10 μm propyzamide for 30 min under constant agitation. The spindle has completely collapsed and the organelles have closely approached the chromosomes (arrow). Note that green fluorescent Golgi stacks are clustered near the center of the metaphase plate (arrowheads).
Figure 11
Figure 11
Golgi stack distribution relative to actin filaments in a metaphase cell. Actin filaments (red) were detected in fixed BY-2 cells by indirect immunofluorescence. A, Actin filaments (Cy3 channel). B, Golgi and ER distribution (fluorescein isothiocyanate channel). C, Chromosomes (DAPI channel). D, Merged fluorescence image showing actin (red) Golgi and ER (green) and chromosomes (blue). Thick actin filaments are found surrounding the phragmosome, in transvacuolar strands, and throughout the cortical cytoplasm. Thinner actin filaments are found throughout the phragmosome and inside the mitotic spindle. The Golgi stack distribution only partially matches that of the actin filaments.

Similar articles

Cited by

References

    1. Andersland JM, Fisher DD, Wymer CL, Cyr RJ, Parthasarathy MV. Characterization of a monoclonal antibody prepared against plant actin. Cell Motil Cytoskel. 1994;29:339–344. - PubMed
    1. Andreeva AV, Kutuzov MA, Evans DE, Hawes CR. The structure and function of the Golgi apparatus: a hundred years of questions. J Exp Bot. 1998;49:1281–1291.
    1. Binarová P, Hause B, Dolezel J, Dráber P. Association of γ-tubulin with kinetochore/centromeric region of plant chromosomes. Plant J. 1998;14:751–757.
    1. Driouich A, Staehelin LA. The plant Golgi apparatus: structural organization and functional properties. In: Berger EG, Roth J, editors. The Golgi apparatus. Basel: Birkhäuser-Verlag; 1997. pp. 275–301.
    1. Dupree P, Sherrier DJ. The plant Golgi apparatus. Biochim Biophys Acta. 1998;1404:259–270. - PubMed

MeSH terms

Substances

LinkOut - more resources