. 2000 Sep 1;19(17):4688-700.
doi: 10.1093/emboj/19.17.4688.

Identification of a new isoform of the human estrogen receptor-alpha (hER-alpha) that is encoded by distinct transcripts and that is able to repress hER-alpha activation function 1

Affiliations

Identification of a new isoform of the human estrogen receptor-alpha (hER-alpha) that is encoded by distinct transcripts and that is able to repress hER-alpha activation function 1

G Flouriot et al. EMBO J. .

Abstract

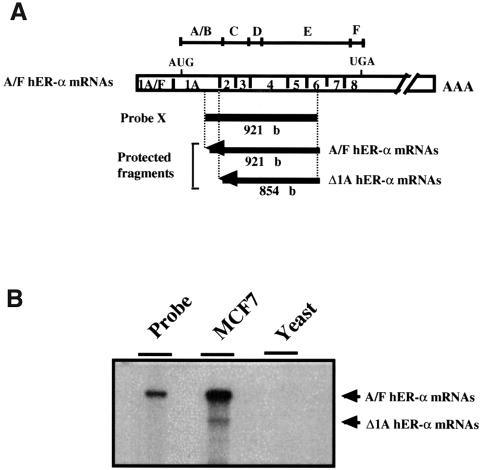
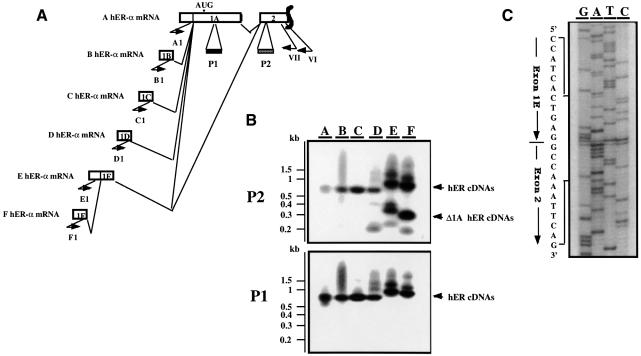
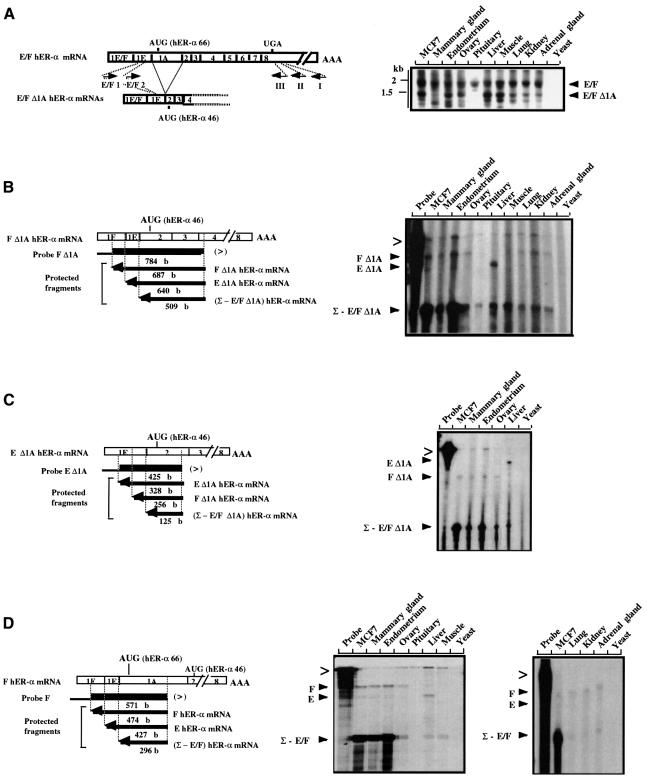
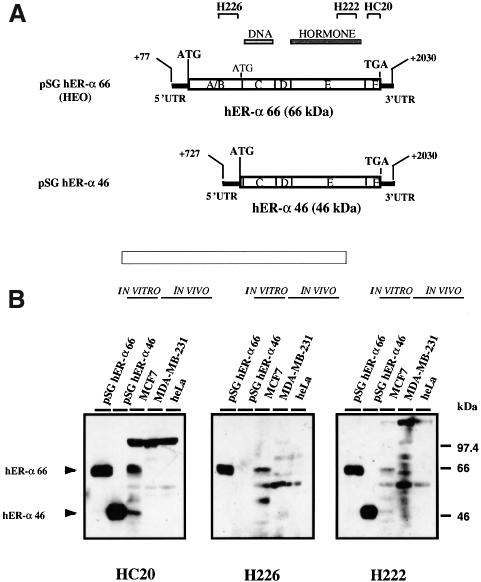
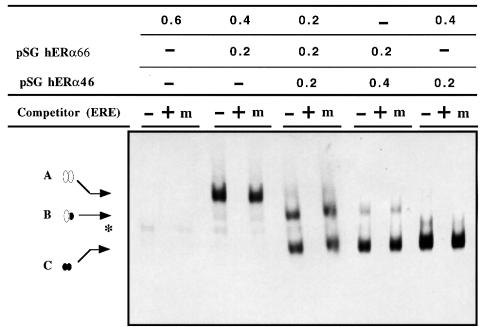
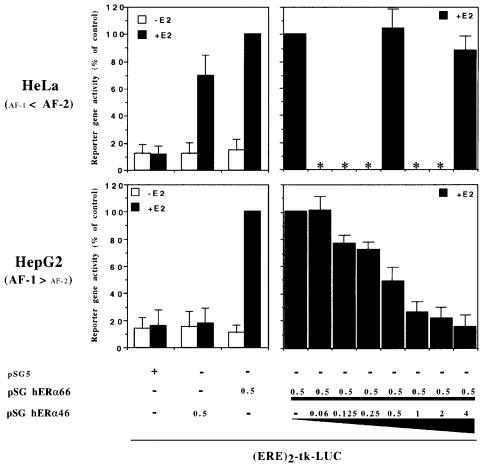
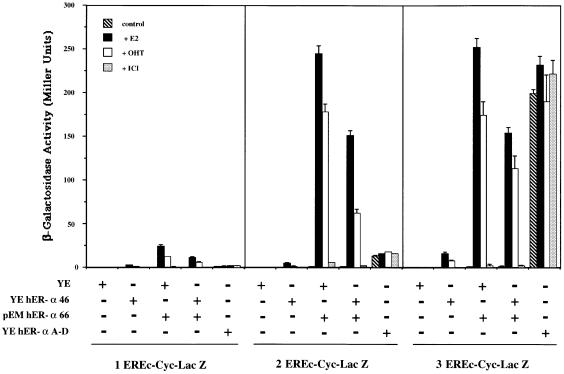
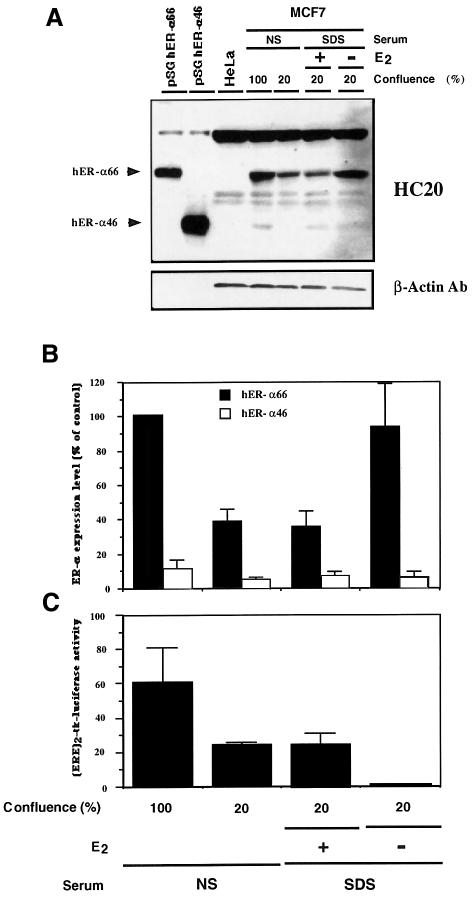
A new isoform of the human estrogen receptor-alpha (hER-alpha) has been identified and characterized. This 46 kDa isoform (hERalpha46) lacks the N-terminal 173 amino acids present in the previously characterized 66 kDa isoform (hERalpha66). hERalpha46 is encoded by a new class of hER-alpha transcript that lacks the first coding exon (exon 1A) of the ER-alpha gene. We demonstrated that these Delta1A hER-alpha transcripts originate from the E and F hER-alpha promoters and are produced by the splicing of exon 1E directly to exon 2. Functional analysis of hERalpha46 showed that, in a cell context sensitive to the transactivation function AF-2, this receptor is an effective ligand-inducible transcription factor. In contrast, hERalpha46 is a powerful inhibitor of hERalpha66 in a cell context where the transactivating function of AF-1 predominates over AF-2. The mechanisms by which the AF-1 dominant-negative action is exerted may involve heterodimeri zation of the two receptor isoforms and/or direct competition for the ER-alpha DNA-binding site. hERalpha66/hERalpha46 ratios change with the cell growth status of the breast carcinoma cell line MCF7, suggesting a role of hERalpha46 in cellular proliferation.


Figures

None
Fig. 1. Evidence for an alternative splicing event at exon 2 acceptor splice site of the hER-α gene. (A) Experimental design for Δ1A hER-α mRNA detection, indicating the location and the size of the single-stranded probe X and each protected fragment obtained after S1 digestion of probe/hER-α mRNA hybrids. Probe X (from +617 to +1538) was specific for normal hER-α transcripts (A/F hER-α mRNAs) but was also able partially to protect Δ1A hER-α mRNA isoforms up to the splice acceptor site position of exon 2. Open boxes indicate the unique (1A–F) and common (1–8) exons encoding each normal hER-α mRNA isoform. The positions of the initiator methionine (AUG) and the termination codon (UGA) are indicated. The division of the hER-α protein into six regions, A–F, is shown directly above the cDNA. (B) Total RNA (30 µg) from MCF7 cells and 30 µg of yeast RNA used as a negative control were hybridized to the labeled S1 probe X, treated with S1 nuclease, and the resistant hybrids were separated on a sequencing gel as described in Materials and methods. The undigested probe is shown in a separate lane.
None
Fig. 2. Exon 1E is alternatively spliced to exon 1A or exon 2. (A) Schematic representation of the RT–PCR experiment designed to identify Δ1A hER-α mRNAs. Open boxes indicate the unique (1A–1F) and the two first common (1A, 2) exons encoding each hER-α mRNA variant. Approximate locations of primers are shown by short arrows. Primer VI, located in exon 2, was used to prime hER-α cDNA synthesis by reverse transcriptase. Primers A1–F1, which are specific for each hER-α cDNA 5′ region, were used in a round of PCR amplification with primer VII, which is nested to primer VI in exon 2. The oligonucleotide probes P1 and P2 from exon 1A and 2, respectively, were used to confirm the specificity of the PCR products as well as the exon 1A deletion for some hER-α transcripts. (B) The hER-α cDNA variants were amplified as described above, using total RNA from MCF7. PCR products were electrophoresed through an agarose gel and transferred by Southern blotting to a membrane, which was then hybridized with the oligonucleotide probes P1 and P2 as described in Materials and methods. Positions of migration of the molecular size markers are shown on the left side of the figure. (C) The sequence of the PCR products from lane E or F (B) that did not hybridize to the oligonucleotide probe P1 but hybridized to P2 probe revealed that they contain the donor site of exon 1E joined to the acceptor site of exon 2.
None
Fig. 3. E/F and E/F Δ1A hER-α mRNA variant distribution analysis. (A) RT–PCR analysis. Open boxes indicate the unique (1E or 1F) and common (part of 1E and 1A–8) exons encoding E/F hER-α mRNA isoforms. Approximate locations of primers are shown by short arrows. Primer I, located in the 3′ UTR of exon 8, was used to prime hER-α cDNA synthesis by reverse transcriptase, using total RNA from various sources as indicated at the top of each lane. Yeast total RNA was used as a negative control. Primer E/F1, which is specific for both E and F hER-α cDNA 5′ regions (in the common part of exon 1E), was then used in a first round of PCR amplification with primer II, which is nested to primer I in exon 8. A second round of PCR was performed with specific (E/F2) and common (III) nested primers. An oligonucleotide probe from exon 2 was used to confirm the specificity of the PCR products. Positions of migration of the molecular size markers are shown on the left side of the figure. (B–D) S1 nuclease mapping analysis. The S1 nuclease mapping assays of E/F and E/F Δ1A hER-α mRNA variants were performed as described in Materials and methods, with the single-stranded probes F (D), F Δ1A (B) and E Δ1A (C), and using 30 µg of total RNA from various sources as indicated at the top of each lane. Yeast total RNA was used as a negative control. The location and the size of each single-stranded probe (F, F Δ1A and E Δ1A) and each protected fragment obtained after S1 digestion of the probe/hER-α mRNA hybrids are indicated. Each probe was specific for one hER-α transcript (for example, F Δ1A hER mRNA) but was also able partially to protect the other hER-α mRNA isoforms [e.g. (Σ – E/F Δ1A) hER mRNA] up to the splice site positions. The probes were designed to contain vector sequence in their extremity (denoted by the thinner black line) in order to discriminate between undigested probes (>) and specific protected fragments.
None
Fig. 4. E/F Δ1A hER-α mRNA isoforms encode a 46 kDa protein, called hERα46, which lacks the A/B domain present in the 66 kDa hER-α. (A) Schematic representation of the cDNAs inserted within the expression vector pSG5, which gave rise to pSG hERα66 (HEO) and pSG hERα46. The position of the initiator methionine for hERα66, the initiator methionine for hERα46 and the common termination codon (TGA) are indicated. The division of the hER-α protein (66 kDa) into six regions, A–F, together with the DNA- (region C) and hormone- (region E) binding domains, is shown directly above the cDNAs. Also shown are the epitopes recognized by the anti-hER antibodies, HC20, H226 and H222, used in (B). HC20 is a polyclonal antibody, and H226 and H222 are monoclonal antibodies. (B) pSG hERα66 and pSG hERα46 plasmids were in vitro transcribed and translated in rabbit reticulocyte lysate. Two microliters of the obtained translation products as well as 20 µg of whole cell extracts from MCF7 (ER-α-positive breast cancer cell line), MDA-MB-231 (ER-α-negative breast cancer cell line) and HeLa (ER-α-negative cell line) were resolved on a 10% SDS–polyacrylamide gel and then subjected to immunoblotting with the HC20, H226 and H222 antibodies. Immunoreactive bands 66 and 46 kDa in size were visualized by ECL.
None
Fig. 5. hERα46 binds specifically in vitro to an ERE as a homodimer or a heterodimer with hERα66. Plasmid samples (0.6 µg) containing different combinations of pSG5, pSG hERα66 and pSG hERα46 vectors, as indicated at the top of each lane (expressed in µg), were in vitro transcribed and translated in rabbit reticulocyte lysate. Four microliters of in vitro translated products were incubated with 60 000 c.p.m. of labeled apoVLDLII-ERE. Specificity was determined in the absence (–) or presence (+) of a 10-fold excess of unlabeled apoVLDLII-ERE competitor, or a 10-fold amount of unlabeled mutant ERE (m) as a non-specific competitor. The positions of the three specific hER-α–DNA complexes (A–C) are indicated by arrows. A corresponds to hERα66 homodimer–ERE complex; B represents hERα66–46 heterodimer–ERE complex; and C represents hERα46 homodimer–ERE complex. An asterisk indicates a non-specific complex.
None
Fig. 6. hERα46 transcriptional properties differ in accordance with the cell sensitivity to ER-α transactivation functions, AF-1 and AF-2. HeLa and HepG2 cell lines are known to present different sensitivity to the two transactivation functions of ER-α, AF-1 and AF-2, as indicated on the left side of the graph (Berry et al., 1990; Tzukerman et al., 1994; Norris et al., 1997). Therefore, these two cell lines were transiently transfected with 5 µg of the reporter plasmid (ERE)2-tk-LUC together with 0.5 µg of the expression vector pSG5, 0.5 µg of pSG hERα46 or 0.5 µg of pSG hERα66 (HEO) alone, or with increasing concentration of pSG hERα46 (0–4 µg). Cells were treated with or without estradiol (10–8 M) for 48 h before being assayed for luciferase activity. Results are expressed as a percentage of the reporter gene activity measured in the presence of the expression vector pSG hERα66 alone and E2. Luciferase activities were normalized using the internal reference control EF-1α–CAT. Values correspond to the average ± standard deviation (SD) of at least three separate transfection experiments. Values not determined are indicated by an asterisk.
None
Fig. 7. hERα46 acts as an inhibitor of hERα66 in yeast. Yeast cells transformed with the reporter genes 1, 2 or 3 EREc-Cyc-Lac Z and a combination of the expression vectors YEpucG (YE), YE hERα46, pEM hERα66 and YE hER-α A–D (as indicated at the bottom of the graph) were grown in the presence or absence of 1 µM estradiol (E2), 10 µM 4-hydroxytamoxifen (OHT) or 10 µM ICI 164,384 (ICI). β-galactosidase activity was assayed and expressed in Miller units. Values correspond to the average ± SD of at least four separate experiments.
None
Fig. 8. hERα66/46 ratios in the MCF7 cell line differ in confluent and non-confluent cells as well as in estradiol-treated and untreated cells. For the study of confluent and non-confluent cells, MCF7 cells were grown to confluency (100%) or non-confluency (20%) in normal DMEM containing 10% calf serum (NS for normal serum); medium was then changed and cells were kept for an additional 3 days under those conditions before harvesting. For the study of estradiol-treated and untreated cells, MCF7 cells were first grown under normal conditions to non-confluency (20%) and, after a PBS wash, were kept for 3 days in phenolred-free medium supplemented with 2.5% charcoal-treated calf serum (SDS for steroid-deprived serum) with (+) or without (–) 10 nM estradiol, before harvesting. Whole cell extracts were prepared as described in Materials and methods. The obtained protein extract (20 µg), as well as 20 µg of HeLa protein extract (negative control) and 2 µl of pSG hERα66 and pSG hERα46 in vitro translated products in rabbit reticulocyte lysate (positive control) were resolved on a 10% SDS–polyacrylamide gel and then subjected to immunoblotting with the HC20 antibody and a β-actin antibody as a control. Immunoreactive proteins were visualized by ECL (A). hERα66 and hERα46 signals were quantified by densitometry and results were expressed as a percentage of the hERα66 level detected in confluent cells (B). Values correspond to the average ± SD of three independent experiments. (C) MCF7 cells, grown in the conditions as previously described, were transiently transfected with 5 µg of the reporter plasmid (ERE)2-tk-LUC. Two days later, cells were assayed for luciferase activity. The luciferase activities were normalized using the internal reference control EF-1α–CAT. Values correspond to the average ± SD of three separate transfection experiments.

Similar articles

Cited by

References

    1. Abbondanza C., De Falco,A., Nigro,V., Medici,N., Armetta,I., Molinari,A.M., Moncharmont,B. and Puca,G.A. (1993) Characterization and epitope mapping of a new panel of monoclonal antibodies to estradiol receptor. Steroids, 58, 4–12. - PubMed
    1. Auchus R.J. and Fuqua,S.A.W. (1994) The oestrogen receptor. In Bailliere’s Clinical Endocrinology and Metabolism: Hormones, Enzymes and Receptors, Vol. 8. Baillière Tindall, London, UK, pp. 433–449. - PubMed
    1. Ausubel F.M., Brent,R., Kingston,R.E., Moore,D.D., Seidman,J.G., Smith,J.A. and Struhl,K. (1989) Current Protocols in Molecular Biology. Wiley-Interscience, New York, NY.
    1. Banroques J., Delahodde,A. and Jacq,C. (1986) A mitochondrial RNA maturase gene transferred to the yeast nucleus can control mitochondrial mRNA splicing. Cell, 46, 837–844. - PubMed
    1. Barraille P., Chinestra,P., Bayard,F. and Faye,J.C. (1999) Alternative initiation of translation accounts for a 67/45 kDa dimorphism of the human estrogen receptor ERα. Biochem. Biophys. Res. Commun., 257, 84–88. - PubMed

Publication types