Comparative Study
. 2000 Aug;10(8):1158-71.
doi: 10.1101/gr.10.8.1158.

High-resolution genetic and physical map of the Lgn1 interval in C57BL/6J implicates Naip2 or Naip5 in Legionella pneumophila pathogenesis

Affiliations
Comparative Study

High-resolution genetic and physical map of the Lgn1 interval in C57BL/6J implicates Naip2 or Naip5 in Legionella pneumophila pathogenesis

J D Growney et al. Genome Res. 2000 Aug.

Abstract

Prior genetic and physical mapping has shown that the Naip gene cluster on mouse chromosome 13D1-D3 contains a gene, Lgn1, that is responsible for determining the permissivity of ex vivo macrophages to Legionella pneumophila replication. We have identified differences in the structure of the Naip array among commonly used inbred mouse strains, although these gross structural differences do not correlate with differences in L. pneumophila permissiveness. A physical map of the region employing clones of the C57BL/6J haplotype confirms that there are fewer copies of Naip in this strain than are in the physical map of the 129 haplotype. We have also refined the genetic location of Lgn1, leaving only Naip2 and Naip5 as candidates for Lgn1. Our genetic map suggests the presence of two hotspots of recombination within the Naip array, indicating that the 3' portion of Naip may be involved in the genomic instability at this locus.


Figures
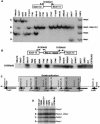
Figure 1
Figure 1
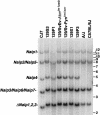
Intron 13 identifies conserved Naip elements. (A) Autoradiography of 6% denaturing polyacrylamide gel of PCR products amplified from the indicated 129 mouse Lgn1 BACs using STS D13Die31 (see Methods). A schematic of D13Die31 is indicated to show primer orientation. Pound sign indicates common primer with D13Die32. Band sizes are labeled AD from largest to smallest. Asterisk indicates nonoverlapping clones in 129 physical map of the Naip array that contain D13Die31-B, indicating four distinct D13Die31-B loci. (B) Autoradiography of 6% denaturing polyacrylamide gel of PCR products amplified from the indicated 129 mouse Lgn1 BACs using STS D13Die32 (see Methods). A schematic of D13Die32 and D13Die33 is indicated to show primer orientation. Pound sign indicates common primer with D13Die31. Asterisk indicates nonoverlapping clones in 129 physical map of the Naip array that contain D13Die32, indicating three distinct D13Die32 loci. Identical patterns of amplification were obtained with D13Die32 (data not shown). (C) Schematic of the structure of the Naip array in mice of the 129 haplotype. Single-copy markers D13Die26 and D13Die3 are indicated, identifying “unique” Naip loci. The four copies of the repeated marker D13Die7 are indicated. Gray shading indicates four subunits of the quadruplication of Naip sequence. Positions of Naip intron 13 loci identified with D13Die31, D13Die32 and D13Die33 are shown. (D) Autoradiography of 6% denaturing polyacrylamide gel of PCR products amplified with D13Die31 on genomic DNA from cell line ES CJ7 and several inbred mouse lines. Band sizes are labeled as in A. Identification of Naip loci are as determined from 129 physical map (Growney et al. 2000).
Figure 2
Figure 2
Amplification of polymorphic microsatellite markers from mouse genomic DNA identifies differences in the Naip repeat structure among inbred mouse strains. Autoradiography of 6% denaturing polyacrylamide gel of PCR products amplified from genomic DNA of the indicated mouse strains using primers for microsatellite markers D13Die7 (A) and D13Die25 (B). Four bands representing four distinct loci for each marker identified in the 129 haplotype are labeled AD, from largest to smallest. A, D13Die7: all 129 substrains analyzed demonstrate four amplified loci. B, D13Die25: band A is polymorphic in 129P3. These markers amplify two distinct bands in A/J and C57BL/6J.
Figure 3
Figure 3
Southern blot analysis of BamHI-digested genomic DNA identifies differences in Naip copy number among inbred mouse strains. Correlation of the Naip exon 11 hybridizing BamHI fragments of genomic DNA from several 129 strains with Naip loci was done by comparison of the fragments in BAC and P1 clones from the 129 haplotype that make up a complete map of the region (data not shown) and from completed genomic sequence (Endrizzi et al. 1999, 2000). Horizontal bars and numbers indicate position and size (kb) of fragments in 1-kb ladder molecular weight marker (GIBCO). A single band of 12 kb mapping to Naip1 and an 8.5-kb doublet fragment mapping to Naip2 and Naip5 are well conserved among all strains. In contrast, the 5-kb fragment mapping to Naip4 is unique to mice of the 129 lineage. A 3.8-kb band mapping to Naip3, Naip6, and Naip7 in the 129 haplotype is polymorphic in other strains. This fragment is less intense in A/J and C57BL/6J. The 2.5-kb fragment mapping to the three ΔNaip loci in the 129 haplotype is significantly decreased in intensity in A/J and C57BL/6J.
Figure 4
Figure 4
Amplification of repetitive polymorphic microsatellite markers mapping within the Naip array of the C57BL/6J haplotype. Autoradiography of 6% denaturing polyacrylamide gel of PCR products amplified from genomic DNA and genomic clones using primers for STS D13Die31 (A) and microsatellite markers D13Die7 (B), D13Die25 (C), D13Die35 (D), and D13Die36 (E). (A) Four bands representing four distinct D13Die31 loci are labeled AD, from largest to smallest. A single genomic clone, 212o22, which includes Naip5 (band C) and Naip1 (band D) spans the entire central repeat region of the Naip array. (BE) Microsatellite repeat markers identify and separate two loci for each marker present in C57BL/6J genomic DNA.
Figure 5
Figure 5
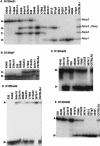
Southern blot analysis of BamHI- and EcoRI-digested BAC DNA identifies six copies of Naip exon 11 and five copies of Naip exon 3. Correlation of the restriction fragments with specific Naip loci was done by comparison of the bands on the BAC blot with predicted fragments from genomic sequence and our previous physical map of the 129 Naip array (data not shown) (Growney et al. 2000). Horizontal bars and numbers indicate position and size (kb) of fragments in 1-kb ladder molecular weight marker (GIBCO). (A) BamHI-digested DNA probed with Naip exon 11 identifies six Naip exon 11 loci. 129 haplotype genomic sequence predicts the observed 14.3-kb fragment mapping to Naip1, a 9-kb fragment mapping to Naip2, an 8.6-kb fragment mapping to Naip5, and a doublet of 3.5 kb and 3.6 kb mapping to Naip6 and Naip3. The remaining 2.2-kb band maps to ΔNaip, as observed in the 129 haplotype (data not shown). Asterisk indicates vector junction fragments mapping to Naip1 and Naip2. (B) EcoRI-digested DNA probed with Naip exon 3 identifies five Naip exon 3 loci. 129 haplotype genomic sequence predicts the observed 10.2-kb fragment mapping to Naip5, an 8.5-kb fragment mapping to Naip2, a 7.5-kb fragment mapping to Naip1, a 7.2-kb fragment mapping to Naip6, and 2.1-kb mapping to Naip3.
Figure 5
Figure 5
Southern blot analysis of BamHI- and EcoRI-digested BAC DNA identifies six copies of Naip exon 11 and five copies of Naip exon 3. Correlation of the restriction fragments with specific Naip loci was done by comparison of the bands on the BAC blot with predicted fragments from genomic sequence and our previous physical map of the 129 Naip array (data not shown) (Growney et al. 2000). Horizontal bars and numbers indicate position and size (kb) of fragments in 1-kb ladder molecular weight marker (GIBCO). (A) BamHI-digested DNA probed with Naip exon 11 identifies six Naip exon 11 loci. 129 haplotype genomic sequence predicts the observed 14.3-kb fragment mapping to Naip1, a 9-kb fragment mapping to Naip2, an 8.6-kb fragment mapping to Naip5, and a doublet of 3.5 kb and 3.6 kb mapping to Naip6 and Naip3. The remaining 2.2-kb band maps to ΔNaip, as observed in the 129 haplotype (data not shown). Asterisk indicates vector junction fragments mapping to Naip1 and Naip2. (B) EcoRI-digested DNA probed with Naip exon 3 identifies five Naip exon 3 loci. 129 haplotype genomic sequence predicts the observed 10.2-kb fragment mapping to Naip5, an 8.5-kb fragment mapping to Naip2, a 7.5-kb fragment mapping to Naip1, a 7.2-kb fragment mapping to Naip6, and 2.1-kb mapping to Naip3.
Figure 6
Figure 6
Complete physical map of the Lgn1 region in the C57BL/6J haplotype identifies five complete Naip genes and one 5′ truncated Naip locus. A physical map is indicated that has been constructed by ordering the clones and loci based on marker content of D13Die7, D13Die25, D13Die35, and D13Die36 (Fig. 5B–E) and several indicated single-copy markers (data not shown; Table 1). Naip gene content was determined by amplification with D13Die31 (Fig. 4A), D13Die32, D13Die33, and D13Die30 (data not shown), as well as Southern blot analysis with Naip exon 3 and Naip exon 11 (Fig. 5). Distal mouse chromosome 13 is indicated by a single horizontal line at the bottom. Genomic clones are indicated by the named horizontal lines. The relative positions of two sequenced 129 BAC clones, 149m19 (AF131205) and 26f17 (AF242431, AF242432) , are indicated with bold horizontal lines. Colored arrows indicate the position and orientation of genes present in the interval. Single-copy marker content is indicated by black circles. Markers within Naip loci are indicated with colored circles. Naip exon 3 and Naip exon 11 loci are indicated by colored circles with black trim. D13Die7 is indicated with filled colored triangles. The position of the single-copy D13Die30 is indicated with black squares. The map is drawn approximately to scale, based on genomic sequence and estimated sizes of C57BL/6J BAC clones. The direction of transcription of Ocln is unknown. The 3′ portion of Tfnr has not been mapped and is indicated with a dashed arrow. RFLP data suggests that C57BL/6J Naip6 has elements of 129 Naip6 and Naip7 (data not shown). Because microsatellite marker data and sequence analysis suggests that these two loci are very similar (Growney et al. 2000; Endrizzi et al. 2000), we designated this locus Naip6 to simplify nomenclature. Accordingly, we have designated specific loci of repeat markers to be consistent with their relative position in the 129 haplotype (for example, D13Die25; see Methods).
Figure 7
Figure 7
Fine genetic mapping of Lgn1. (A) Sequence chromatograms of PCR products amplified with D13Die30.2 from genomic DNA of A/J, C57BL/6J, and selected backcross animals. Extensive sequencing of D13Die30.2 PCR products from A/J and C57BL/6J genomic DNA (see Methods) detected a single nucleotide polymorphism at position 51 in the 1479 bp corresponding to D13Die30 (A/J, A; C57BL/6J, G). D13Die30.2 PCR products from 10 backcross animals were sequenced with D13Die30-F and Die30-seq3. These animals include two A/J-like controls (211, 686), three heterozygous controls (150, 176, and 204) and five animals previously identified as recombinants within the Naip array (226, 771, 541, 549, and 661). Partial sequence tracings using primer D13Die30-F spanning the SNP at position 51 in D13Die30 from selected animals are shown. Heterozygous animals 226, 771, and 549 have two equivalent peaks at this position. (B) Polymorphic markers spanning the Naip array were assayed on genomic DNA from 10 animals in our Lgn1 cross (see Methods). Marker positions are indicated as ordered in the C57BL/6J haplotype (Fig. 6). Black squares indicate heterozygous loci, open circles indicate A/J-like homozygous loci. Three recombination events (541, 661, and 549) were mapped between D13Die26 and D13Die37, located within Naip2. Two recombination events (226 and 771) were mapped between D13Die30 and D13Die36-A, located within ΔNaip. The genetic interval for Lgn1, including the 5′ portion of Naip2, all of Naip5, and the 3′ portion of ΔNaip are indicated. The Lgn1 phenotype is indicated at the bottom (C57BL/6J nonpermissive; A/J permissive).
Figure 8
Figure 8
Comparative map of Naip array in mice of the 129 and C57BL/6J haplotypes. A summary of physical maps constructed in two different inbred mouse strains is indicated. Conserved gene loci are indicated by common colors. Repeat microsatellite markers identify a quadruplication in mice of the 129 lineage and a duplication in the C57BL/6J haplotype. Gray shading indicates the two complete and two partial Naip loci specific to the 129 haplotype. A hypothetical insertion point between Naip5 and ΔNaip in the C57BL/6J haplotype is indicated (see Discussion). The genetically mapped Lgn1 interval is indicated in the C57BL/6J haplotype. Two open boxes indicate the positions of two recombination hot spots identified in our Lgn1 backcross.

Similar articles

Cited by

References

    1. Beckers M C, Yoshida S, Morgan K, Skamene E, Gros P. Natural resistance to infection with Legionella pneumophila: chromosomal localization of the Lgn1 susceptibility gene. Mamm Genome. 1995;6:540–545. - PubMed
    1. Bergin A, Kim G, Price D L, Sisodia S S, Lee M K, Rabin B A. Identification and characterization of a mouse homologue of the spinal muscular atrophy–determining gene, survival motor neuron. Gene. 1997;204:47–53. - PubMed
    1. Burglen L, Lefebvre S, Clermont O, Burlet P, Viollet L, Cruaud C, Munnich A, Melki J. Structure and organization of the human survival motor neurone (SMN) gene. Genomics. 1996;32:479–482. - PubMed
    1. Burglen L, Seroz T, Miniou P, Lefebvre S, Burlet P, Munnich A, Pequignot E V, Egly J M, Melki J. The gene encoding p44, a subunit of the transcription factor TFIIH, is involved in large-scale deletions associated with Werdnig-Hoffmann disease. Am J Hum Genet. 1997;60:72–79. - PMC - PubMed
    1. Burlet P, Burglen L, Clermont O, Lefebvre S, Viollet L, Munnich A, Melki J. Large scale deletions of the 5q13 region are specific to Werdnig- Hoffmann disease. J Med Genet. 1996;33:281–283. - PMC - PubMed

Publication types

Associated data