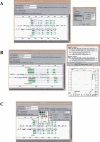
Alfresco--a workbench for comparative genomic sequence analysis
- PMID: 10958633
- PMCID: PMC310917
- DOI: 10.1101/gr.10.8.1148
Alfresco--a workbench for comparative genomic sequence analysis
Abstract
Comparative analysis of genomic sequences provides a powerful tool for identifying regions of potential biologic function; by comparing corresponding regions of genomes from suitable species, protein coding or regulatory regions can be identified by their homology. This requires the use of several specific types of computational analysis tools. Many programs exist for these types of analysis; not many exist for overall view/control of the results, which is necessary for large-scale genomic sequence analysis. Using Java, we have developed a new visualization tool that allows effective comparative genome sequence analysis. The program handles a pair of sequences from putatively homologous regions in different species. Results from various different existing external analysis programs, such as database searching, gene prediction, repeat masking, and alignment programs, are visualized and used to find corresponding functional sequence domains in the two sequences. The user interacts with the program through a graphic display of the genome regions, in which an independently scrollable and zoomable symbolic representation of the sequences is shown. As an example, the analysis of two unannotated orthologous genomic sequences from human and mouse containing parts of the UTY locus is presented.
Figures


Similar articles
-
GATA: a graphic alignment tool for comparative sequence analysis.BMC Bioinformatics. 2005 Jan 17;6:9. doi: 10.1186/1471-2105-6-9. BMC Bioinformatics. 2005. PMID: 15655071 Free PMC article.
-
SeqHelp: a program to analyze molecular sequences utilizing common computational resources.Genome Res. 1998 Mar;8(3):306-12. doi: 10.1101/gr.8.3.306. Genome Res. 1998. PMID: 9521933 Free PMC article.
-
GenoMiner: a tool for genome-wide search of coding and non-coding conserved sequence tags.Bioinformatics. 2006 Feb 15;22(4):497-9. doi: 10.1093/bioinformatics/bti754. Epub 2005 Nov 2. Bioinformatics. 2006. PMID: 16267081
-
Bioinformatics for the 'bench biologist': how to find regulatory regions in genomic DNA.Nat Immunol. 2004 Aug;5(8):768-74. doi: 10.1038/ni0804-768. Nat Immunol. 2004. PMID: 15282556 Review.
-
Computation and analysis of genomic multi-sequence alignments.Annu Rev Genomics Hum Genet. 2007;8:193-213. doi: 10.1146/annurev.genom.8.080706.092300. Annu Rev Genomics Hum Genet. 2007. PMID: 17489682 Review.
Cited by
-
DNannotator: Annotation software tool kit for regional genomic sequences.Nucleic Acids Res. 2003 Jul 1;31(13):3729-35. doi: 10.1093/nar/gkg542. Nucleic Acids Res. 2003. PMID: 12824405 Free PMC article.
-
Insights from human/mouse genome comparisons.Mamm Genome. 2003 Jul;14(7):429-36. doi: 10.1007/s00335-002-4001-1. Mamm Genome. 2003. PMID: 12925891 Review.
-
Identification of conserved regulatory elements by comparative genome analysis.J Biol. 2003;2(2):13. doi: 10.1186/1475-4924-2-13. Epub 2003 May 22. J Biol. 2003. PMID: 12760745 Free PMC article.
-
CGAS: comparative genomic analysis server.Bioinformatics. 2009 Apr 1;25(7):958-9. doi: 10.1093/bioinformatics/btp086. Epub 2009 Feb 13. Bioinformatics. 2009. PMID: 19218352 Free PMC article.
-
Comparative genomic tools and databases: providing insights into the human genome.J Clin Invest. 2003 Apr;111(8):1099-106. doi: 10.1172/JCI17842. J Clin Invest. 2003. PMID: 12697725 Free PMC article. Review. No abstract available.
References
-
- Adams MD, Celniker SE, Holt RA, Evans CA, Gocayne JD, Amanatides PG, Scherer SE, Li PW, Hoskins RA, Galle RF, et al. The genome sequence of Drosophila melanogaster. Science. 2000;287:2185–2195. - PubMed
-
- Barillot E, Leser U, Lijnzaad P, Cussat-Blanc C, Jungfer K, Guyon F, Vaysseix G, Helgesen C, Rodriguez-Tome P. A proposal for a standard CORBA interface for genome maps. Bioinformatics. 1999;15:157–169. - PubMed
-
- Bederson, B.B. and Hollan, J.D. 1994. Pad++: A zooming graphical interface for exploring alternate interface physics. Proceedings of the ACM Symposium on User Interface Software and Technology, November 2–4, 1994, Marina del Ray, CA USA. p. 17–26.
-
- Birney, E. and Durbin, R. 1997. Wise2. http://www.sanger.ac.uk/Software/Wise2.
Publication types
MeSH terms
Grants and funding
LinkOut - more resources
Full Text Sources
Other Literature Sources
Research Materials
