. 2000 Sep;20(17):6537-49.
doi: 10.1128/MCB.20.17.6537-6549.2000.

A bromodomain protein, MCAP, associates with mitotic chromosomes and affects G(2)-to-M transition

Affiliations

A bromodomain protein, MCAP, associates with mitotic chromosomes and affects G(2)-to-M transition

A Dey et al. Mol Cell Biol. 2000 Sep.

Abstract

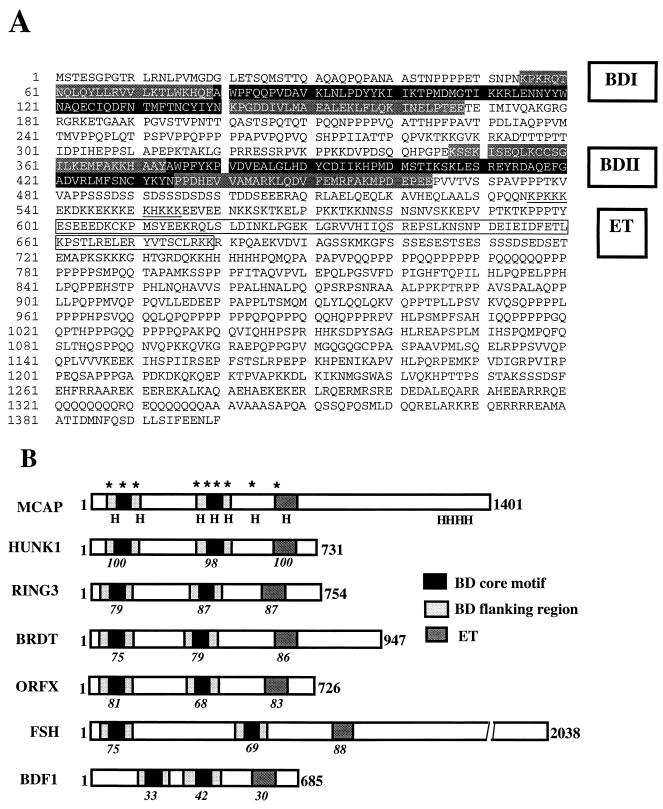
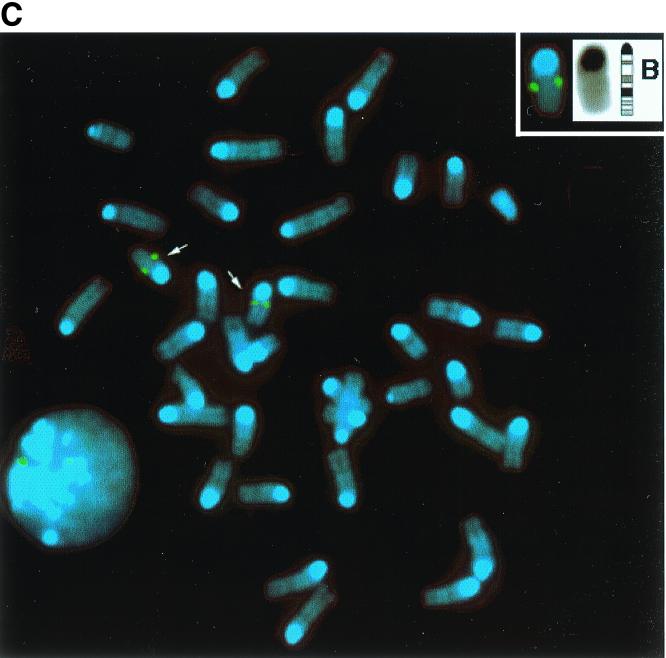
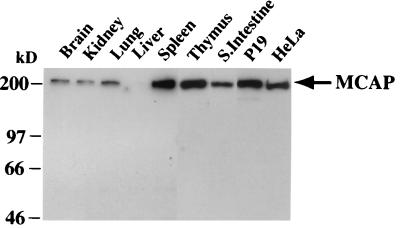
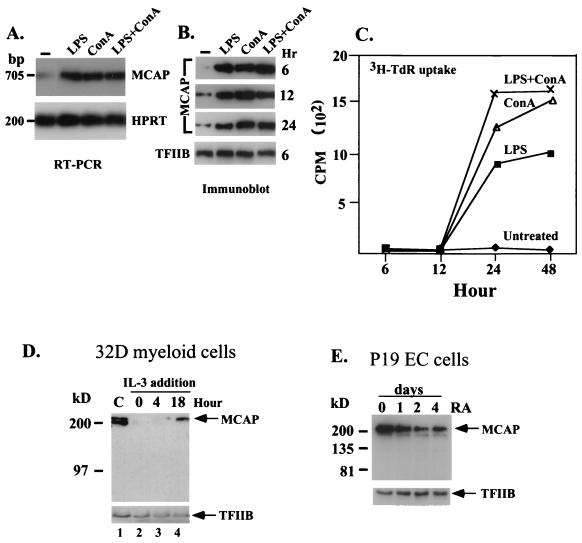
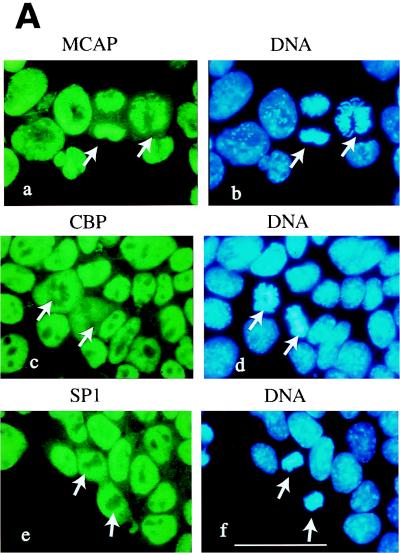
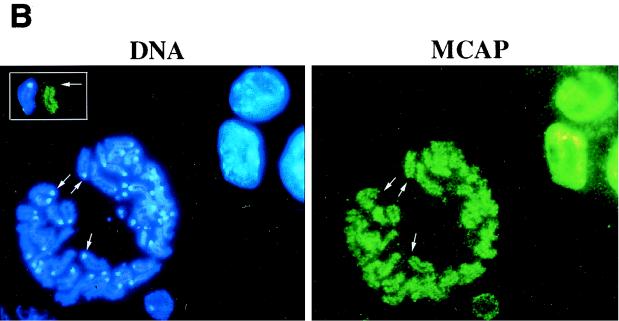
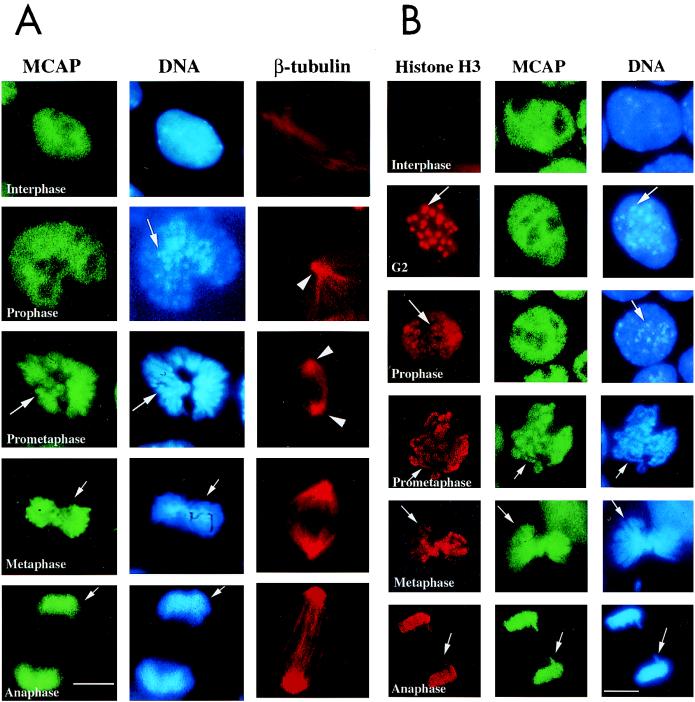
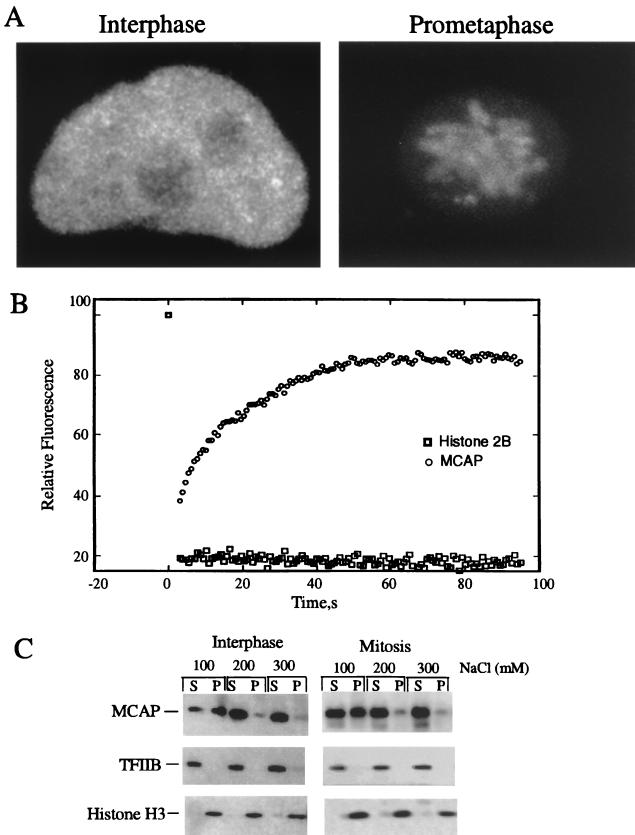
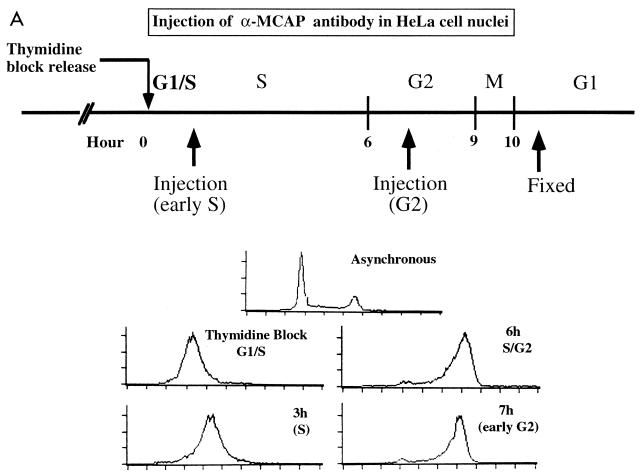
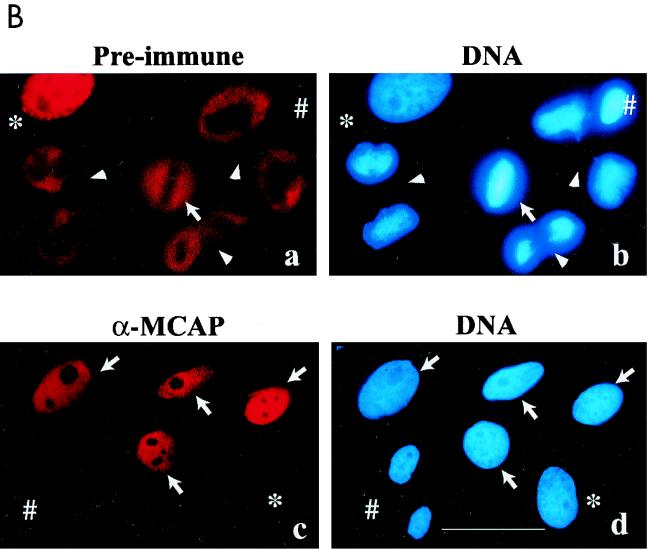
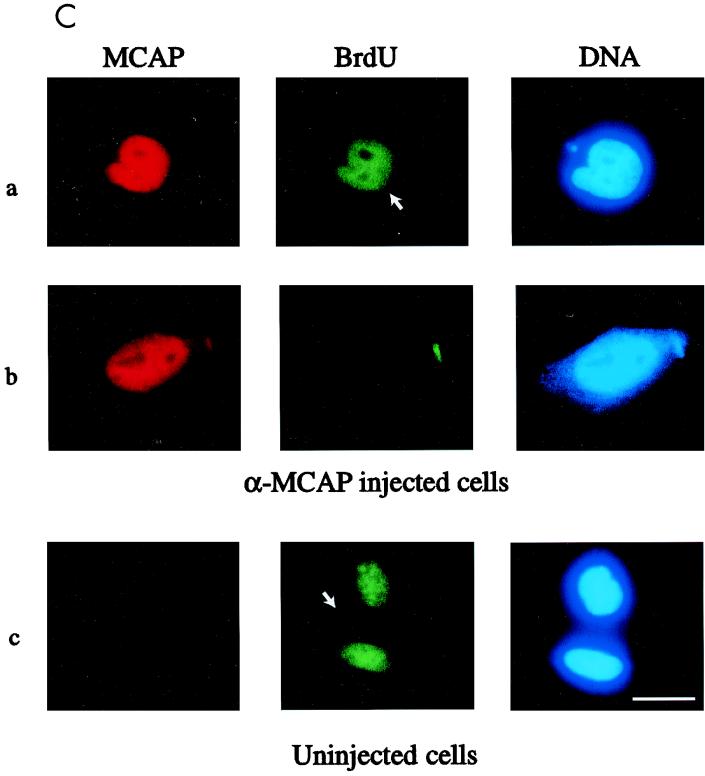
We describe a novel nuclear factor called mitotic chromosome-associated protein (MCAP), which belongs to the poorly understood BET subgroup of the bromodomain superfamily. Expression of the 200-kDa MCAP was linked to cell division, as it was induced by growth stimulation and repressed by growth inhibition. The most notable feature of MCAP was its association with chromosomes during mitosis, observed at a time when the majority of nuclear regulatory factors were released into the cytoplasm, coinciding with global cessation of transcription. Indicative of its predominant interaction with euchromatin, MCAP localized on mitotic chromosomes with exquisite specificity: (i) MCAP-chromosome association became evident subsequent to the initiation of histone H3 phosphorylation and early chromosomal condensation; and (ii) MCAP was absent from centromeres, the sites of heterochromatin. Supporting a role for MCAP in G(2)/M transition, microinjection of anti-MCAP antibody into HeLa cell nuclei completely inhibited the entry into mitosis, without abrogating the ongoing DNA replication. These results suggest that MCAP plays a role in a process governing chromosomal dynamics during mitosis.


Figures

FIG. 1
FIG. 1
Amino acid sequence and chromosomal mapping of murine MCAP. (A) Predicted amino acid sequence of MCAP. A single open reading frame containing 1,400 amino acids was derived from a 5,281-bp cDNA. Two bromodomains (BDI and BDII) are shaded (black; core motif; light gray; flanking motif). The dark gray box represents the ET domain. (B) Comparison with other BET subgroup members. The number in italics below each motif represents the percent amino acid homology with MCAP; an asterisk indicates a kinase-like motif; H indicates a predicted helix. (C) FISH mapping of MCAP to murine chromosome 17. Normal male mouse metaphase chromosomes showing two signals (arrows) were visualized with fluorescein isothiocyanate (green dots) and counterstained with 4′, 6-diamidino-2-phenylindole (DAPI) (blue). The inset reveals chromosome 17 in the inverted DAPI image and ideogram for chromosome 17. The position of the hybridization signal was determined by alignment of band B. Note that two signals can also be seen in the interphase nucleus.
FIG. 1
FIG. 1
Amino acid sequence and chromosomal mapping of murine MCAP. (A) Predicted amino acid sequence of MCAP. A single open reading frame containing 1,400 amino acids was derived from a 5,281-bp cDNA. Two bromodomains (BDI and BDII) are shaded (black; core motif; light gray; flanking motif). The dark gray box represents the ET domain. (B) Comparison with other BET subgroup members. The number in italics below each motif represents the percent amino acid homology with MCAP; an asterisk indicates a kinase-like motif; H indicates a predicted helix. (C) FISH mapping of MCAP to murine chromosome 17. Normal male mouse metaphase chromosomes showing two signals (arrows) were visualized with fluorescein isothiocyanate (green dots) and counterstained with 4′, 6-diamidino-2-phenylindole (DAPI) (blue). The inset reveals chromosome 17 in the inverted DAPI image and ideogram for chromosome 17. The position of the hybridization signal was determined by alignment of band B. Note that two signals can also be seen in the interphase nucleus.
FIG. 2
FIG. 2
MCAP protein expression detected by immunoblot analysis using anti-MCAP antibody with 10 μg of nuclear extracts from adult mouse tissues, HeLa cells, or P19 cells. S. Intestine, small intestine.
FIG. 3
FIG. 3
MCAP expression is linked to cell growth. (A) Induction of MCAP RNA in mitogen-stimulated lymphocytes. Spleen cells were stimulated by indicated mitogens for 6 h, and MCAP transcripts were detected by semiquantitative RT-PCR. HPRT transcripts were tested as a control for RNA loading. (B) Induction of MCAP protein in mitogen-stimulated lymphocytes. Nuclear extracts (2.5 μg) from spleen cells stimulated by indicated mitogens were analyzed for MCAP expression by immunoblot assay. TFIIB was tested as a control for protein loading. (C) [3H]TdR uptake. Spleen cells stimulated by mitogens were labeled with 1 μCi of [3H]TdR at indicated times for 2 h. Values represent averages of triplicate determinations. (D) Inhibition of MCAP protein expression following IL-3 withdrawal. 32D cells were grown in the presence (lane 1) or absence (lane 2) of IL-3 for 6 h, or IL-3 was added back for 4 or 18 h (lanes 3 and 4). Nuclear extracts (5 μg) were analyzed by immunoblot assay. (E) Down-regulation of MCAP protein expression in P19 cells after RA treatment. Nuclear extracts (10 μg) from P19 cells treated with 1 μM of all-trans RA for indicated days were analyzed by immunoblot assay.
FIG. 4
FIG. 4
Localization of MCAP on mitotic chromosomes. (A) Indirect immunofluorescent staining of P19 cells. P19 cells were fixed with paraformaldehyde and stained with antibodies against MCAP (N-MCAP) (a), CBP (c), or Sp1 (e) and counterstained with Hoechst 33342 (b, d, and f). In image a, MCAP is present on mitotic chromosomes in two mitotic cells (arrows); in images c and e, CBP and Sp1 are dispersed into the cytoplasm and are absent from mitotic chromosomes. All three factors are present in the interphase nuclei. The bar in image F corresponds to 10 μm. (B) Absence of MCAP from centromeres. P19 cells treated with hypotonic buffer were stained with anti-MCAP antibody and counterstained with Hoechst 33342 as above. Note that the entire axis of chromosomes is stained with MCAP except for the centromeres (arrows). The inset is an example of a chromosome showing the absence of MCAP from the centromeres at the end of chromosomes that are intensely stained with Hoechst (arrows).
FIG. 4
FIG. 4
Localization of MCAP on mitotic chromosomes. (A) Indirect immunofluorescent staining of P19 cells. P19 cells were fixed with paraformaldehyde and stained with antibodies against MCAP (N-MCAP) (a), CBP (c), or Sp1 (e) and counterstained with Hoechst 33342 (b, d, and f). In image a, MCAP is present on mitotic chromosomes in two mitotic cells (arrows); in images c and e, CBP and Sp1 are dispersed into the cytoplasm and are absent from mitotic chromosomes. All three factors are present in the interphase nuclei. The bar in image F corresponds to 10 μm. (B) Absence of MCAP from centromeres. P19 cells treated with hypotonic buffer were stained with anti-MCAP antibody and counterstained with Hoechst 33342 as above. Note that the entire axis of chromosomes is stained with MCAP except for the centromeres (arrows). The inset is an example of a chromosome showing the absence of MCAP from the centromeres at the end of chromosomes that are intensely stained with Hoechst (arrows).
FIG. 5
FIG. 5
Fine timing of MCAP chromosome staining. (A) P19 cells were stained with anti-MCAP antibody, Hoechst 33342, and anti-β-tubulin antibody. Arrows in prophase indicate condensing chromosomes. At this stage, MCAP distribution is uniform over the entire nucleus. In prometaphase, centrioles move toward the opposite poles (arrowheads), the nuclear membrane breaks down, and chromosome condensation increases (arrow). At this stage, chromosomes begins to be stained with MCAP antibody (arrow). During metaphase, MCAP is found entirely on fully condensed chromosomes that were assemble on the metaphase plate. MCAP remains on chromosomes in anaphase, when they are pulled apart in two daughter cells. The bar corresponds to 3.5 μm. (B) Colocalization analysis with phospho-histone H3. P19 cells were stained with antibody to phospho-histone H3, MCAP, or Hoechst 33342. In G2 and prophase, phospho-histone H3 localizes on the pericentric heterochromatin regions, which condense early and are seen as large dots (arrows in G2 and prophase). MCAP is uniformly distributed over the nucleus at these stages. When cells reach prometaphase and move from metaphase to anaphase, phospho-histone H3 staining spreads over the entire, fully condensed chromosomes, overlapping MCAP staining (arrows).
FIG. 6
FIG. 6
(A) Three-dimensional reconstruction of GFP-MCAP localization in living cells. Three-dimensional images were reconstructed with serial z sections of HeLa or NRK cells to visualize the distribution of MCAP-GFP in the interphase (left) and in mitosis (right). (B) Mobility of MCAP by FRAP analysis. HeLa cells were transfected with GFP-MCAP or histone H2B-GFP, and recovery of fluorescence in interphase was analyzed. (C) Biochemical solubility of MCAP. Homogenates from asynchronous or mitotic HeLa cells were extracted with indicated concentrations of NaCl. Supernatants and pellets were analyzed by immunoblot analysis. Each lane was loaded with extract proteins equivalent to 105 cells.
FIG. 7
FIG. 7
Anti-MCAP antibody injection inhibits the entry into mitosis. (A) Diagram of microinjection experiments. HeLa cells were synchronized by double-thymidine block and released. The lower panel represents a typical cell cycle profile monitored by FACS analysis. Anti-MCAP IgG (N-MCAP) or preimmune IgG was injected into the nuclei at S or G2 phase, and cells were allowed to proceed through mitosis. Cells were fixed, stained with the second antibody, and counterstained with Hoechst 33342. (B) Morphology of injected cells. (a and b) Cells injected with preimmune IgG. Arrowheads, mitotic cells stained with second antibody; *, interphase cell stained with antibody (escaping synchronization); #, uninjected cell in mitosis. (c and d) Cells injected with anti-MCAP antibody. Arrows, cells injected with anti-MCAP IgG which failed to enter into mitosis; ∗, uninjected cell in interphase; #, uninjected cells which proceeded to mitosis. The bar indicates 8 μM. (C) Anti-MCAP IgG injection does not abrogate ongoing DNA synthesis. Cells in S phase were injected with anti-MCAP IgG and then incubated with 10 μM BrdU for 1 h and allowed to proceed as for panel A. Cells were stained for injected IgG, BrdU, and DNA. (a) Cell injected with anti-MCAP antibody that incorporated BrdU; (b) cell injected with anti-MCAP antibody that was out of synchrony and failed to incorporate BrdU (a control for BrdU staining). (c) Uninjected cells which incorporated BrdU and proceeded through mitosis, tested as a control for the intensity and pattern of BrdU staining. The bar corresponds to 6 μm.
FIG. 7
FIG. 7
Anti-MCAP antibody injection inhibits the entry into mitosis. (A) Diagram of microinjection experiments. HeLa cells were synchronized by double-thymidine block and released. The lower panel represents a typical cell cycle profile monitored by FACS analysis. Anti-MCAP IgG (N-MCAP) or preimmune IgG was injected into the nuclei at S or G2 phase, and cells were allowed to proceed through mitosis. Cells were fixed, stained with the second antibody, and counterstained with Hoechst 33342. (B) Morphology of injected cells. (a and b) Cells injected with preimmune IgG. Arrowheads, mitotic cells stained with second antibody; *, interphase cell stained with antibody (escaping synchronization); #, uninjected cell in mitosis. (c and d) Cells injected with anti-MCAP antibody. Arrows, cells injected with anti-MCAP IgG which failed to enter into mitosis; ∗, uninjected cell in interphase; #, uninjected cells which proceeded to mitosis. The bar indicates 8 μM. (C) Anti-MCAP IgG injection does not abrogate ongoing DNA synthesis. Cells in S phase were injected with anti-MCAP IgG and then incubated with 10 μM BrdU for 1 h and allowed to proceed as for panel A. Cells were stained for injected IgG, BrdU, and DNA. (a) Cell injected with anti-MCAP antibody that incorporated BrdU; (b) cell injected with anti-MCAP antibody that was out of synchrony and failed to incorporate BrdU (a control for BrdU staining). (c) Uninjected cells which incorporated BrdU and proceeded through mitosis, tested as a control for the intensity and pattern of BrdU staining. The bar corresponds to 6 μm.

Similar articles

Cited by

References

    1. Abney J R, Cutler B, Fillbach M L, Axelrod D, Scalettar B A. Chromatin dynamics in interphase nuclei and its implications for nuclear structure. J Cell Biol. 1997;137:1459–1468. - PMC - PubMed
    1. Beck S, Hanson I, Kelly A, Pappin D J, Trowsdale J. A homologue of the Drosophila female sterile homeotic (fsh) gene in the class II region of the human MHC. DNA Seq. 1992;2:203–210. - PubMed
    1. Chua P, Roeder G S. Bdf1, a yeast chromosomal protein required for sporulation. Mol Cell Biol. 1995;15:3685–3696. - PMC - PubMed
    1. Coligan J, Kruisbeek A, Shevach E, Margulies D, editors. Current protocols in immunology. New York, N.Y: John Wiley & Sons; 1997.
    1. Coverley D, Laskey R A. Regulation of eukaryotic DNA replication. Annu Rev Biochem. 1994;63:745–776. - PubMed

MeSH terms