. 2000 Aug 7;192(3):359-66.
doi: 10.1084/jem.192.3.359.

A hierarchical role for classical pathway complement proteins in the clearance of apoptotic cells in vivo

Affiliations

A hierarchical role for classical pathway complement proteins in the clearance of apoptotic cells in vivo

P R Taylor et al. J Exp Med. .

Abstract

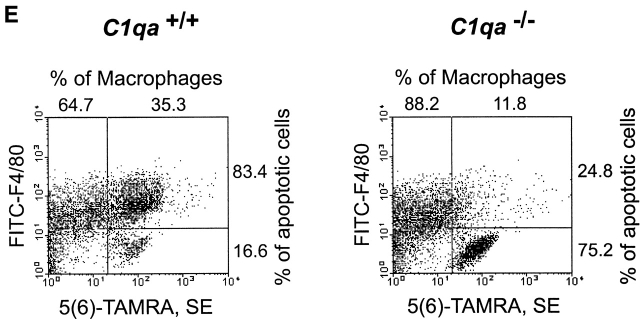
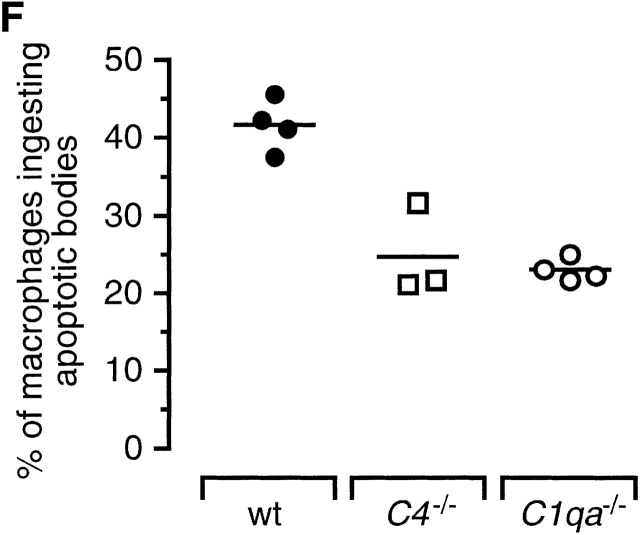
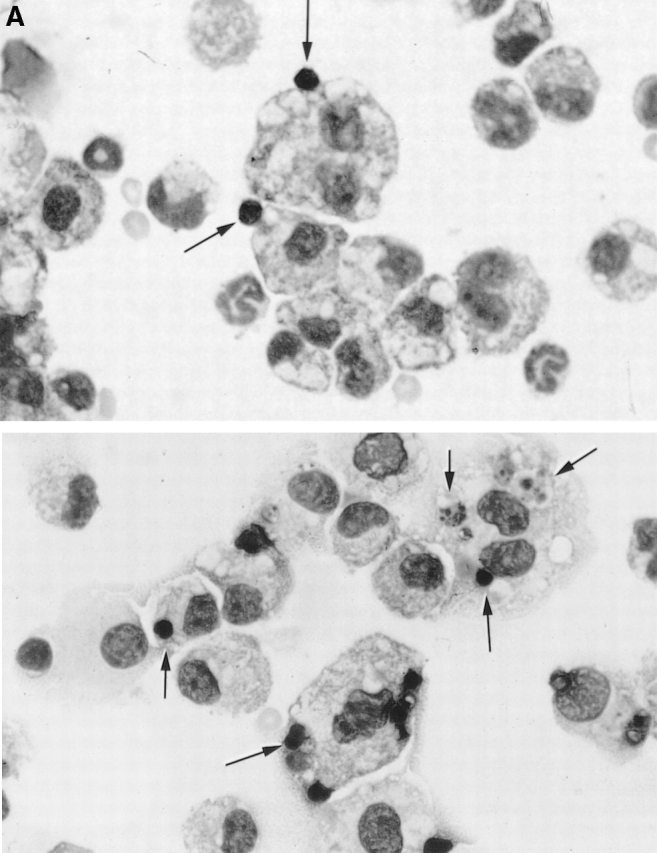
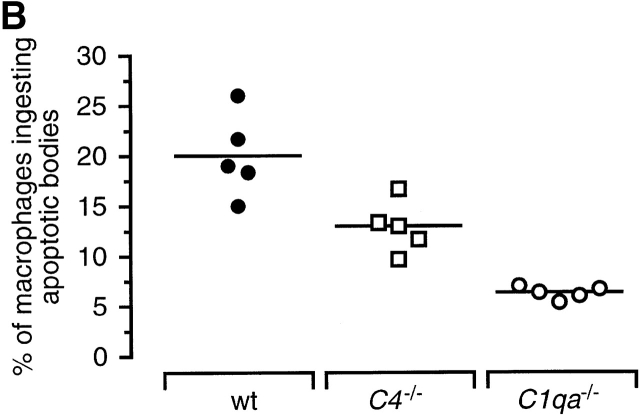
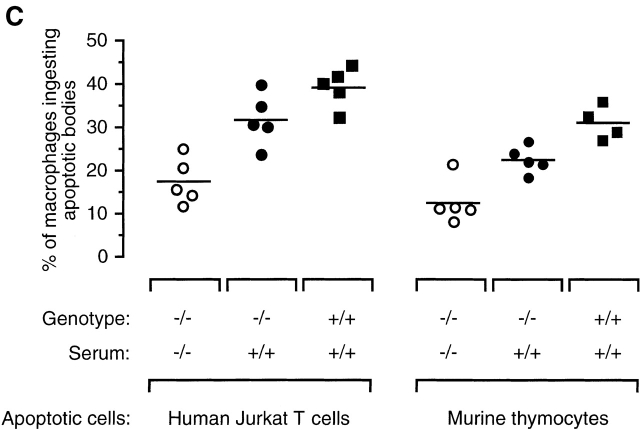
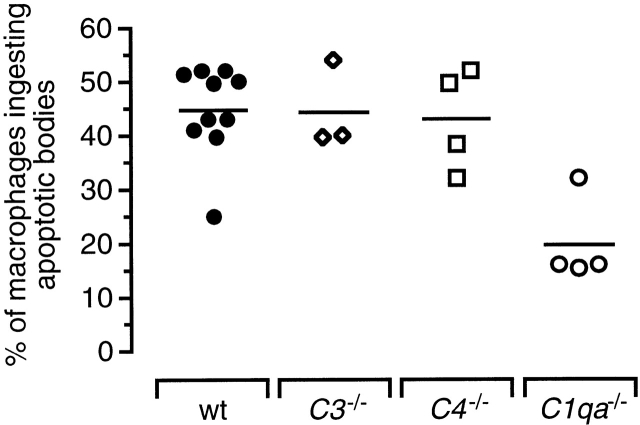
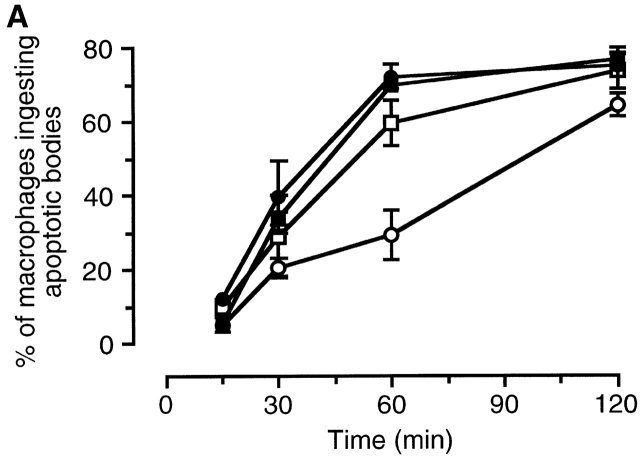
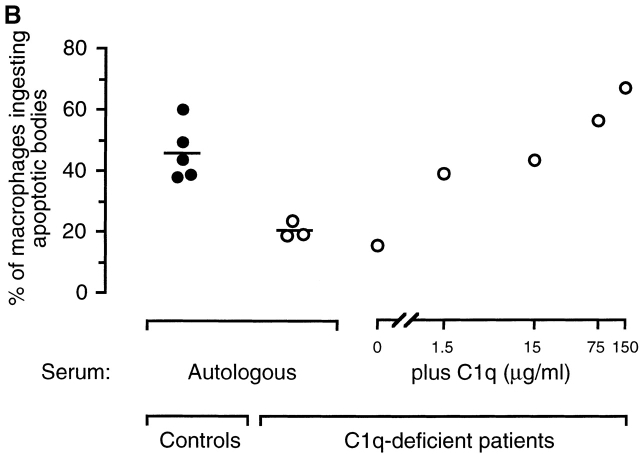
The strongest susceptibility genes for the development of systemic lupus erythematosus (SLE) in humans are null mutants of classical pathway complement proteins. There is a hierarchy of disease susceptibility and severity according to the position of the missing protein in the activation pathway, with the severest disease associated with C1q deficiency. Here we demonstrate, using novel in vivo models of apoptotic cell clearance during sterile peritonitis, a similar hierarchical role for classical pathway complement proteins in vivo in the clearance of apoptotic cells by macrophages. Our results constitute the first demonstration of an impairment in the phagocytosis of apoptotic cells by macrophages in vivo in a mammalian system. Apoptotic cells are thought to be a major source of the autoantigens of SLE, and impairment of their removal by complement may explain the link between hereditary complement deficiency and the development of SLE.


Figures

Figure 1
Figure 1
Phagocytic clearance of apoptotic Jurkat T cells during sterile peritonitis. Mice were injected intraperitoneally with 107 apoptotic human Jurkat T cells 4 d after treatment with thioglycollate. (A) Graph showing the percentage of inflammatory macrophages from C57BL/6 mice phagocytosing apoptotic bodies at different time points after injection. The C1qa −/− mice (○) showed a significant delay in phagocytic uptake of the apoptotic cells compared with the wild-type mice (•) (P < 0.01 after 15 and 30 min, Student's t test; data shown corresponds to mean ± SEM of three to four mice in each group). (B) Graph showing the number of uningested apoptotic cells remaining free in the peritoneum of the mice shown in A. The C1qa −/− animals had a significant delay in the clearance of the apoptotic cells as a consequence of the impaired phagocytosis (P < 0.05 at the 15 and 60 min time points, Student's t test; data shown corresponds to mean ± SEM). (C) Scatter plots showing the percentage of elicited peritoneal macrophages containing phagocytosed apoptotic bodies 30 min after intraperitoneal injection of apoptotic Jurkat T cells. C1qa −/− mice (○) showed a significant reduction in the phagocytosis of apoptotic bodies compared with C1qa +/+ mice (•) irrespective of the genetic backgrounds of the experimental animals (horizontal bars denote means; P < 0.005 in each of the three experiments, Student's t test). (D) Peritoneal recruitment of macrophages in response to thioglycollate in wild-type (black bars), C1q-deficient (white bars), and C4-deficient (hatched bars) mice. Although neither C1q nor C4 deficiency affected macrophage recruitment, the number of macrophages elicited by thioglycollate was dependent on the genetic background of the animals used (C57BL/6 > 129/Sv × C57BL/6 > 129/Sv). The data shown represents the mean ± SEM of four to eight mice in each group. (E) FACS® analysis of the phagocytic uptake of 5(6)-TAMRA, SE–labeled apoptotic cells by F4/80+ peritoneal macrophages 30 min after the injection of apoptotic cells in C1q-deficient and wild-type mice (129/Sv × C57BL/6). The F4/80+, 5(6)-TAMRA, SE+ cells represent macrophages associated with apoptotic cells. Significantly fewer F4/80+ cells were associated with the 5(6)-TAMRA, SE+ apoptotic cells in the C1qa −/− animals. (F) Graph showing the percentage of phagocytosing macrophages 30 min after injection of 107 apoptotic Jurkat cells into C1qa −/−, C4 −/−, and wild-type (wt) 129/Sv × C57BL/6 mice during sterile peritonitis. The phagocytic uptake was significantly different between the three groups (P = 0.0002, one-way ANOVA). Both C1qa −/− (○) and C4 −/− (□) mice exhibited significantly impaired phagocytosis compared with the wild-type (•) mice (P < 0.001 and P < 0.01, respectively, Bonferroni multiple comparison test). Data shown is representative of three independent experiments. Horizontal bars denote means.
Figure 1
Figure 1
Phagocytic clearance of apoptotic Jurkat T cells during sterile peritonitis. Mice were injected intraperitoneally with 107 apoptotic human Jurkat T cells 4 d after treatment with thioglycollate. (A) Graph showing the percentage of inflammatory macrophages from C57BL/6 mice phagocytosing apoptotic bodies at different time points after injection. The C1qa −/− mice (○) showed a significant delay in phagocytic uptake of the apoptotic cells compared with the wild-type mice (•) (P < 0.01 after 15 and 30 min, Student's t test; data shown corresponds to mean ± SEM of three to four mice in each group). (B) Graph showing the number of uningested apoptotic cells remaining free in the peritoneum of the mice shown in A. The C1qa −/− animals had a significant delay in the clearance of the apoptotic cells as a consequence of the impaired phagocytosis (P < 0.05 at the 15 and 60 min time points, Student's t test; data shown corresponds to mean ± SEM). (C) Scatter plots showing the percentage of elicited peritoneal macrophages containing phagocytosed apoptotic bodies 30 min after intraperitoneal injection of apoptotic Jurkat T cells. C1qa −/− mice (○) showed a significant reduction in the phagocytosis of apoptotic bodies compared with C1qa +/+ mice (•) irrespective of the genetic backgrounds of the experimental animals (horizontal bars denote means; P < 0.005 in each of the three experiments, Student's t test). (D) Peritoneal recruitment of macrophages in response to thioglycollate in wild-type (black bars), C1q-deficient (white bars), and C4-deficient (hatched bars) mice. Although neither C1q nor C4 deficiency affected macrophage recruitment, the number of macrophages elicited by thioglycollate was dependent on the genetic background of the animals used (C57BL/6 > 129/Sv × C57BL/6 > 129/Sv). The data shown represents the mean ± SEM of four to eight mice in each group. (E) FACS® analysis of the phagocytic uptake of 5(6)-TAMRA, SE–labeled apoptotic cells by F4/80+ peritoneal macrophages 30 min after the injection of apoptotic cells in C1q-deficient and wild-type mice (129/Sv × C57BL/6). The F4/80+, 5(6)-TAMRA, SE+ cells represent macrophages associated with apoptotic cells. Significantly fewer F4/80+ cells were associated with the 5(6)-TAMRA, SE+ apoptotic cells in the C1qa −/− animals. (F) Graph showing the percentage of phagocytosing macrophages 30 min after injection of 107 apoptotic Jurkat cells into C1qa −/−, C4 −/−, and wild-type (wt) 129/Sv × C57BL/6 mice during sterile peritonitis. The phagocytic uptake was significantly different between the three groups (P = 0.0002, one-way ANOVA). Both C1qa −/− (○) and C4 −/− (□) mice exhibited significantly impaired phagocytosis compared with the wild-type (•) mice (P < 0.001 and P < 0.01, respectively, Bonferroni multiple comparison test). Data shown is representative of three independent experiments. Horizontal bars denote means.
Figure 2
Figure 2
Phagocytosis of apoptotic murine thymocytes by inflammatory macrophages. (A) Representative photomicrographs of cytospin preparations of peritoneal lavage cells from C1q-deficient (top) and wild-type (bottom) mice recovered 30 min after injection with 3 × 10⁷ apoptotic thymocytes, 4 d after injection of thioglycollate. Arrows indicate apoptotic bodies. (B) Phagocytosis of apoptotic thymocytes by inflammatory macrophages of C1qa −/− (○), C4 −/− (□), and wild-type (wt; •) 129/Sv × C57BL/6 mice was significantly different (P < 0.0001, one-way ANOVA). Phagocytosis in the C1qa −/− mice was significantly lower than the uptake in the C4 −/− and the wild-type mice (P < 0.01 and P < 0.001, respectively, Bonferroni multiple comparison test); however, the C4 −/− mice also exhibited a defect in phagocytosis compared with control mice (P < 0.01, Bonferroni multiple comparison test). Horizontal bars denote means. (C) Reconstitution of C1q-deficient mice with wild-type serum. Apoptotic Jurkat T cells or murine thymocytes were suspended in a 20% vol/vol solution of C1q-deficient (open symbols) or -sufficient (closed symbols) mouse serum and injected into C1qa −/− (circles) and C1qa +/+ (squares) mice as indicated. The phagocytic uptake between the groups was significantly different 30 min after injection (P = 0.0001 in both separate experiments, one-way ANOVA). Phagocytosis in the reconstituted C1qa −/− mice injected with normal mouse serum was significantly higher than in the C1qa −/− mice injected with C1q-deficient serum when either Jurkat T cells or thymocytes were used (P < 0.01 in both experiments, Bonferroni multiple comparison tests). Horizontal bars denote means. Phagocytosis was scored on coded cytospin preparations. Mice used for the reconstitution experiments with apoptotic Jurkat cells and apoptotic thymocytes were on the C57BL/6 and 129/Sv genetic backgrounds, respectively.
Figure 2
Figure 2
Phagocytosis of apoptotic murine thymocytes by inflammatory macrophages. (A) Representative photomicrographs of cytospin preparations of peritoneal lavage cells from C1q-deficient (top) and wild-type (bottom) mice recovered 30 min after injection with 3 × 10⁷ apoptotic thymocytes, 4 d after injection of thioglycollate. Arrows indicate apoptotic bodies. (B) Phagocytosis of apoptotic thymocytes by inflammatory macrophages of C1qa −/− (○), C4 −/− (□), and wild-type (wt; •) 129/Sv × C57BL/6 mice was significantly different (P < 0.0001, one-way ANOVA). Phagocytosis in the C1qa −/− mice was significantly lower than the uptake in the C4 −/− and the wild-type mice (P < 0.01 and P < 0.001, respectively, Bonferroni multiple comparison test); however, the C4 −/− mice also exhibited a defect in phagocytosis compared with control mice (P < 0.01, Bonferroni multiple comparison test). Horizontal bars denote means. (C) Reconstitution of C1q-deficient mice with wild-type serum. Apoptotic Jurkat T cells or murine thymocytes were suspended in a 20% vol/vol solution of C1q-deficient (open symbols) or -sufficient (closed symbols) mouse serum and injected into C1qa −/− (circles) and C1qa +/+ (squares) mice as indicated. The phagocytic uptake between the groups was significantly different 30 min after injection (P = 0.0001 in both separate experiments, one-way ANOVA). Phagocytosis in the reconstituted C1qa −/− mice injected with normal mouse serum was significantly higher than in the C1qa −/− mice injected with C1q-deficient serum when either Jurkat T cells or thymocytes were used (P < 0.01 in both experiments, Bonferroni multiple comparison tests). Horizontal bars denote means. Phagocytosis was scored on coded cytospin preparations. Mice used for the reconstitution experiments with apoptotic Jurkat cells and apoptotic thymocytes were on the C57BL/6 and 129/Sv genetic backgrounds, respectively.
Figure 3
Figure 3
Clearance of apoptotic mouse thymocytes by resident peritoneal macrophages. The phagocytic uptake by resident peritoneal macrophages 30 min after the intraperitoneal injection of 2 × 10⁷ apoptotic cells was significantly reduced in C1qa −/− (○) mice compared with C4 −/− (□), C3 −/− (⋄), and wild-type (wt) 129/Sv × C57BL/6 (•) control mice. Data shown represents two pooled representative experiments (P < 0.01, P < 0.01, and P < 0.001, respectively, Bonferroni multiple comparison test; P = 0.0009, one-way ANOVA). Horizontal bars denote means. Phagocytosis was scored on coded cytospin preparations. Impaired phagocytic uptake by the resident macrophages in the C1qa −/− animals was observed in three separate experiments (data not shown).
Figure 4
Figure 4
Phagocytosis of apoptotic Jurkat T cells by human monocyte–derived macrophages from three C1q-deficient patients. (A) The phagocytic uptake of apoptotic cells by C1q-deficient macrophages (○) in vitro showed a kinetic defect when compared with both of the normal controls (•, ▪) (at 60 min, P < 0.01 in both cases, Bonferroni multiple comparison test; P = 0.001, one-way ANOVA). When the C1q-deficient serum was reconstituted with 75 μg/ml of purified C1q (□), the phagocytic uptake was no longer significantly different from the controls. Data shown represents the mean ± SEM for triplicate samples. (B) C1q-deficient macrophages, from three individual patients, in autologous serum (○) showed a significant reduction in phagocytosis compared with normal controls (•) after 60-min incubation (P = 0.0038, Student's t test). Addition of purified human C1q protein to the autologous C1q-deficient serum (final concentration of 75 μg/ml in the serum) of one patient rectified the defect in the phagocytic uptake of apoptotic bodies in a dose-dependent manner. Data shown corresponds to the mean of three to four wells for each individual, and horizontal bars denote means.
Figure 4
Figure 4
Phagocytosis of apoptotic Jurkat T cells by human monocyte–derived macrophages from three C1q-deficient patients. (A) The phagocytic uptake of apoptotic cells by C1q-deficient macrophages (○) in vitro showed a kinetic defect when compared with both of the normal controls (•, ▪) (at 60 min, P < 0.01 in both cases, Bonferroni multiple comparison test; P = 0.001, one-way ANOVA). When the C1q-deficient serum was reconstituted with 75 μg/ml of purified C1q (□), the phagocytic uptake was no longer significantly different from the controls. Data shown represents the mean ± SEM for triplicate samples. (B) C1q-deficient macrophages, from three individual patients, in autologous serum (○) showed a significant reduction in phagocytosis compared with normal controls (•) after 60-min incubation (P = 0.0038, Student's t test). Addition of purified human C1q protein to the autologous C1q-deficient serum (final concentration of 75 μg/ml in the serum) of one patient rectified the defect in the phagocytic uptake of apoptotic bodies in a dose-dependent manner. Data shown corresponds to the mean of three to four wells for each individual, and horizontal bars denote means.

Similar articles

Cited by

References

    1. Morgan B.P., Walport M.J. Complement deficiency and disease. Immunol. Today. 1991;12:301–306. - PubMed
    1. Botto M., Dell'Agnola C., Bygrave A.E., Thompson E.M., Cook H.T., Petry F., Loos M., Pandolfi P.P., Walport M.J. Homozygous C1q deficiency causes glomerulonephritis associated with multiple apoptotic bodies. Nat. Genet. 1998;19:56–59. - PubMed
    1. Korb L.C., Ahearn J.M. C1q binds directly and specifically to surface blebs of apoptotic human keratinocytescomplement deficiency and systemic lupus erythematosus revisited. J. Immunol. 1997;158:4525–4528. - PubMed
    1. Casciola-Rosen L.A., Anhalt G., Rosen A. Autoantigens targeted in systemic lupus erythematosus are clustered in two populations of surface structures on apoptotic keratinocytes. J. Exp. Med. 1994;179:1317–1330. - PMC - PubMed
    1. Mevorach D., Zhou J.L., Song X., Elkon K.B. Systemic exposure to irradiated apoptotic cells induces autoantibody production J. Exp. Med. 188 1998. 387 392b - PMC - PubMed

Publication types