. 2000 Jul 17;19(14):3597-607.
doi: 10.1093/emboj/19.14.3597.

NAIP interacts with hippocalcin and protects neurons against calcium-induced cell death through caspase-3-dependent and -independent pathways

Affiliations

NAIP interacts with hippocalcin and protects neurons against calcium-induced cell death through caspase-3-dependent and -independent pathways

E A Mercer et al. EMBO J. .

Abstract

Inhibitor-of-apoptosis proteins (IAPs), including neuronal apoptosis inhibitory protein (NAIP), inhibit cell death. Other IAPs inhibit key caspase proteases which effect cell death, but the mechanism by which NAIP acts is unknown. Here we report that NAIP, through its third baculovirus inhibitory repeat domain (BIR3), binds the neuron-restricted calcium-binding protein, hippocalcin, in an interaction promoted by calcium. In neuronal cell lines NSC-34 and Neuro-2a, over-expression of the BIR domains of NAIP (NAIP-BIR1-3) counteracted the calcium-induced cell death induced by ionomycin and thapsigargin. This protective capacity was significantly enhanced when NAIP-BIR1-3 was co-expressed with hippocalcin. Over-expression of the BIR3 domain or hippocalcin alone did not substantially enhance cell survival, but co-expression greatly increased their protective effects. These data suggest synergy between NAIP and hippocalcin in facilitating neuronal survival against calcium-induced death stimuli mediated through the BIR3 domain. Analysis of caspase activity after thapsigargin treatment revealed that caspase-3 is activated in NSC-34, but not Neuro-2a, cells. Thus NAIP, in conjunction with hippocalcin, can protect neurons against calcium-induced cell death in caspase-3-activated and non-activated pathways.


Figures

None
Fig. 1. Effect of NAIP-BIR1–3 on survival of NSC-34 cells after ionomycin treatment. NSC-34 cells were stably transfected with expression vectors encoding NAIP-BIR1–3 or human Bcl-2. Control and transfected cell lines were treated with different concentrations of ionomycin and kept in culture for 24 h. Cell viability was analyzed using the MTT assay and survival in the absence of ionomycin was set at 100%. Values represent the mean ± SEM of three independent experiments. *p <0.001 for NAIP-BIR1–3 and Bcl-2 versus mock transfected, and p <0.005 for NAIP-BIR1–3 versus Bcl-2. Three cell lines over-expressing the various cDNA constructs were tested, in each case giving similar results.
None
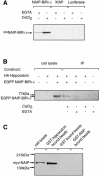
Fig. 2. The BIR domains of NAIP interact with hippocalcin. (A) GST-tagged hippocalcin immobilized on glutathione beads was incubated for 1 h with 35S-labelled NAIP-BIR1–3 generated in vitro. Following centrifugation and washing, the beads were boiled in SDS–PAGE sample buffer and the proteins were resolved by SDS–PAGE and visualized by autoradiography. (B) COS-7 cells were transiently transfected with expression vectors encoding HA-tagged hippocalcin and EGFP–NAIP-BIR1–3. Cells were lysed 48 h after transfection, and anti-HA immunoprecipitates or total cell lysates were analyzed for the presence of EGFP–NAIP-BIR1–3 by western blotting. Immunopreciptiation was performed in the absence (1 mM EGTA) or presence of 1 mM CaCl2. (C) Lysates from COS-7 cells over-expressing myc-tagged full-length NAIP were incubated with GST-tagged hippocalcin, GST alone and control GST-tagged RAP, immobilized on glutathione beads. The presence of bound NAIP after washing was determined by western blot analysis using an anti-Myc antibody.
None
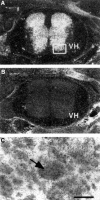
Fig. 3. Presence of hippocalcin mRNA in neonatal rat spinal cord. (A) A synthetic oligonucleotide probe specific for rat hippocalcin was radiolabeled and in situ hybridization was performed as described in Materials and methods. (B) Control hybridization performed with a 200-fold excess of ‘cold’ probe. (C) High magnification of boxed region shown in (A). Arrow indicates motor neuron in lamina 9. Scale bar represents 50 µM. VH denotes ventral horn.
None
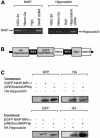
Fig. 4. Inhibition of calcium-induced cell death by NAIP-BIR1–3 and hippocalcin in neuronal cells. (A) Expression of NAIP and hippocalcin in NSC-34 and Neuro-2a cells. mRNA was detected by RT–PCR on total RNA. Specific bands for NAIP (283 bp) and hippocalcin (166 bp) were seen after agarose gel electrophoresis. Empty lanes represent water blank without cDNA. cDNA corresponding to mouse NAIP (1–1100 bp) cloned into pBluescript and human hippocalcin in pACT2 (primers specific for both human and mouse) were used as positive controls. (B) Tricistronic cDNA used for transfection. cDNA encoding HA-tagged hippocalcin and EGFP–NAIP-BIR1–3, separated by an IRES sequence, were cloned into pIRESneo expression vector. (C) Western blot analysis shows the presence of EGFP–NAIP-BIR1–3 and HA–hippocalcin fusion proteins in stably transfected NSC-34 (upper panels) and Neuro-2a (lower panels) cells. (D and E), Wild-type NSC-34 cells (control) and cells stably transfected with EGFP–NAIP-BIR1–3 (NAIP-BIR1–3), HA–hippocalcin (Hippocalcin) and EGFP–NAIP-BIR1–3/HA–hippocalcin (NAIP-BIR1–3 + Hippocalcin) were treated for 24 h with 0.3 µM ionomycin (D) or 0.75 µM thapsigargin (E). Cell viability was determined by MTT assay. Values represent the means ± SEM of three independent experiments. **p <0.001 for NAIP-BIR1–3 and NAIP-BIR1–3 + hippocalcin versus control; *p <0.002 for hippocalcin versus control. #, p <0.001 for NAIP-BIR1–3 + hippocalcin versus NAIP-BIR1–3. (F) Release of LDH after treatment of wild-type and transfected cells with 0.75 µM thapsigargin. Values represent the mean ± SEM (n = 4). *p <0.001 for transfected versus control cells. (G) Wild-type Neuro-2a cells (control) and cells stably transfected with EGFP–NAIP-BIR1–3, HA–hippocalcin and EGFP–NAIP-BIR1–3 + HA–hippocalcin were treated for 24 h with 0.75 µM thapsigargin. Cell viability was determined by MTT assay. Values represent the means ± SEM of three independent experiments. *p <0.006 for NAIP-BIR1–3 versus control; **p <0.001 for NAIP-BIR1–3 + hippocalcin versus control; #, p <0.001 for NAIP-BIR1–3 + hippocalcin versus NAIP-BIR. Three different cell lines over-expressing the various cDNA constructs were tested, in each case giving similar results.
None
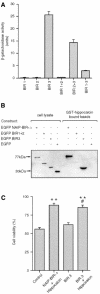
Fig. 5. The BIR3 domain of NAIP binds hippocalcin to protect against calcium-induced cell death. (A) Yeast two-hybrid assay for binding of the various BIR domains of NAIP to hippocalcin. Yeast cells (Y190) were co-transformed with pACT2 expression vector encoding hippocalcin fused to the activation domain of GAL4, and one of six pYTH6 expression vector constructs encoding one or more of the BIR domains of NAIP each fused to the GAL4 DNA-binding domain. β-galactosidase activity of the double transformants was determined in a liquid assay using ONPG as substrate. (B) COS-7 cells were transiently transfected with EGFP–NAIP-BIR1–3, EGFP–BIR1+2, EGFP–BIR3 and EGFP. Cells were lysed and samples analysed by western blot (lanes 1–4). Lysates containing approximately equivalent amounts of EGFP (fusion) protein were incubated, in the presence of 1 mM CaCl2, with GST–hippocalcin immobilized on glutathione beads. After washing, the presence of bound EGFP fusion proteins was determined by western blot analysis using antibody specific for EGFP (lanes 5–8). (C) Wild-type Neuro-2a cells (control) and cells stably transfected with EGFP–NAIP-BIR1–3 + HA–hippocalcin, EGFP–BIR3 and EGFP–BIR3 + HA–hippocalcin were treated for 24 h with 0.75 µM thapsigargin and cell viability was determined by MTT assay. Values represent the mean ± SEM (n = 4). **p <0.001 for NAIP-BIR1–3 + hippocalcin and BIR3 + hippocalcin versus control. #, p <0.001 for BIR3 + hippocalcin versus BIR3.
None
Fig. 6. Caspase-3 is activated in NSC-34 cells after staurosporine or thapsigargin treatment. (A) Staurosporine (10 nM) or thapsigargin (0.75 µM) was added to NSC-34 and, at indicated times, cells were lysed and caspase-3/7 activity was measured as described in Materials and methods. (B) Wild-type NSC-34 cells (control) and cells stably transfected with EGFP–NAIP-BIR1–3 (NAIP-BIR1–3) and EGFP–NAIP-BIR1–3/HA–hippocalcin (NAIP-BIR1–3 + Hippocalcin) were treated for 24 h with thapsigargin (0.75 µM) and the lysates were assayed for caspase-3/7 activity. Values represent the mean ± SEM (n = 3). *p <0.001 for NAIP-BIR1–3 versus control. **p <0.001 for NAIP-BIR1–3 + hippocalcin versus control. (C) NSC-34 cells were treated with thapsigargin (TG) or staurosporine (STS) for 24 h at the concentrations indicated above and stained for activated caspase-3.
None
Fig. 7. Caspase-3 is activated in Neuro-2a cells after staurosporine treatment but not after thapsigargin treatment. (A) Staurosporine (10 nM) or thapsigargin (0.75 µM) was added to Neuro-2a and, at the indicated times, cells were lysed and caspase-3/7 activity was measured as described in Materials and methods. (B) Staurosporine (10 nM) or thapsigargin (10 µM) was applied for 24 h to Neuro-2a cells in the presence or absence of z-DEVD-fmk (1 µM) and cell viability was determined by MTT assay. Values indicate the mean ± SEM (n = 7) and are representative of three independent experiments. *p <0.001 for staurosporine + z-DEVD-fmk versus staurosporine. (C) Neuro-2a cells were treated with thapsigargin (TG) or staurosporine (STS) for 24 h at the concentrations indicated above and stained for activated caspase-3. (D) Lysates prepared from untreated Neuro-2a cells and cells treated with staurosporine (10 nM) or thapsigargin (0.75 µM) for 24 h were subjected to western blotting using an antibody specific for PARP (116 kDa) and its 89 kDa fragment (CII10).

Similar articles

Cited by

References

    1. Adams J.M. and Cory,S. (1998) The Bcl-2 protein family: arbiters of cell survival. Science, 281, 1322–1326. - PubMed
    1. Adamus G., Machnicki,M., Elerding,H., Sugden,B., Blocker,Y.S. and Fox,D.A. (1998) Antibodies to recoverin induce apoptosis of photoreceptor and bipolar cells in vivo. J. Autoimmun., 11, 523–533. - PubMed
    1. Ambrosini G., Adida,C. and Altieri,D.C. (1997) A novel anti-apoptosis gene, survivin, expressed in cancer and lymphoma. Nature Med., 3, 917–921. - PubMed
    1. Aspenstrom P. and Olson,M.F. (1995) Yeast two-hybrid system to detect protein–protein interactions with Rho GTPases. Methods Enzymol., 256, 228–241. - PubMed
    1. Berridge M.J., Bootman,M.D. and Lipp,P. (1998) Calcium—a life and death signal. Nature, 395, 645–648. - PubMed

Publication types

MeSH terms