. 2000 Aug;20(15):5490-502.
doi: 10.1128/MCB.20.15.5490-5502.2000.

HMG-I/Y, a new c-Myc target gene and potential oncogene

Affiliations

HMG-I/Y, a new c-Myc target gene and potential oncogene

L J Wood et al. Mol Cell Biol. 2000 Aug.

Abstract

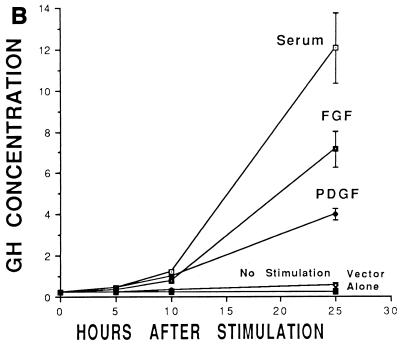
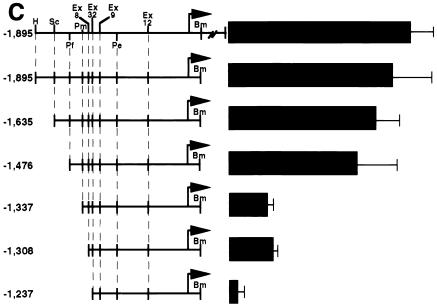
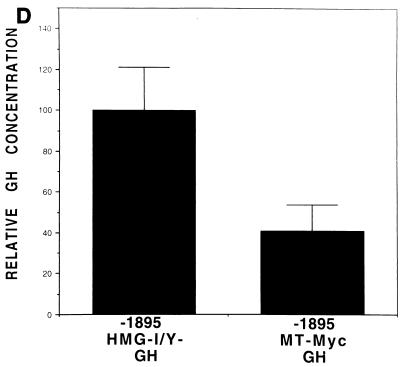
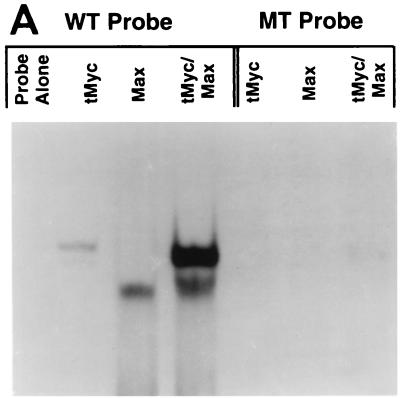
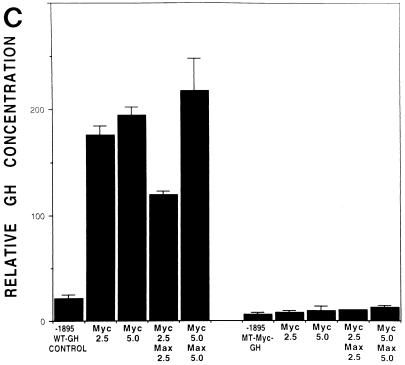
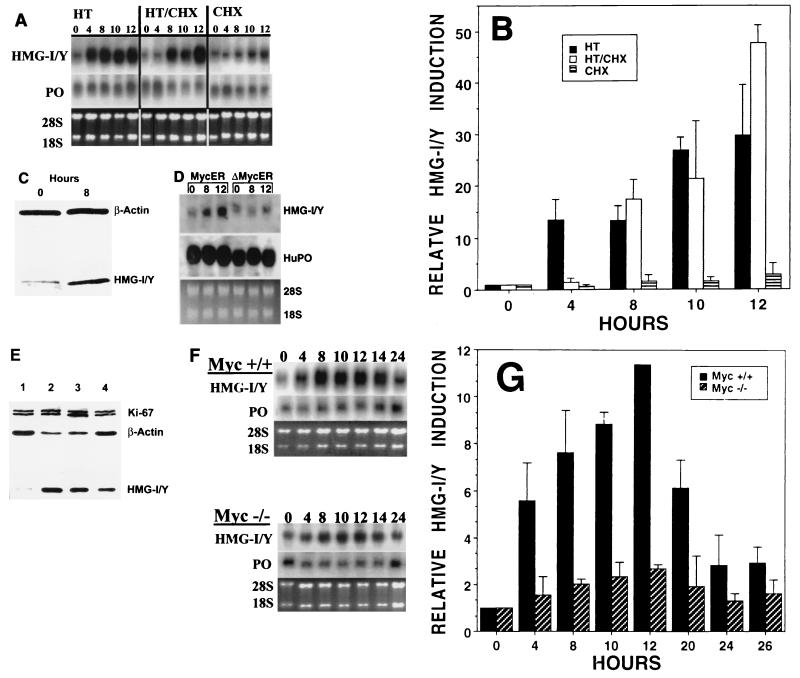
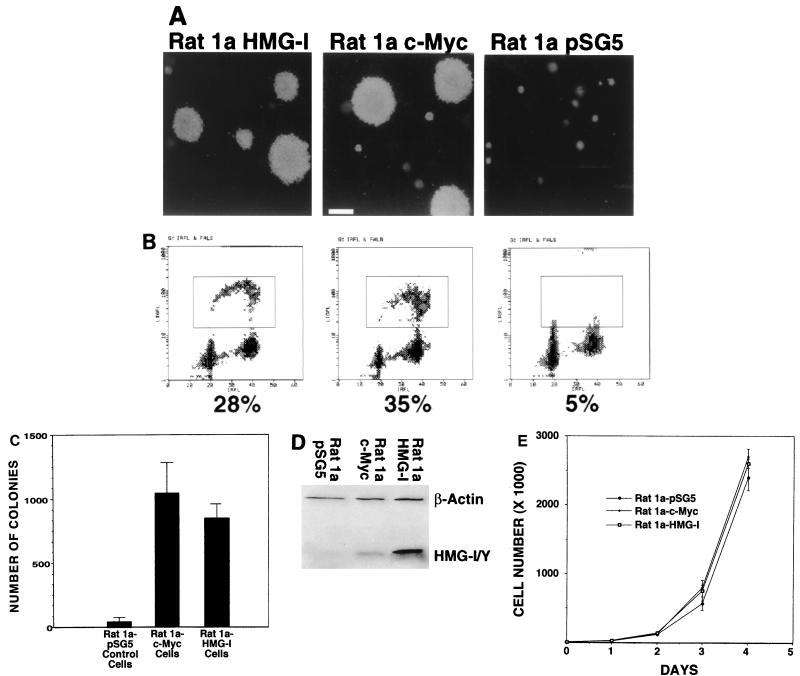
The HMG-I/Y gene encodes the HMG-I and HMG-Y proteins, which function as architectural chromatin binding proteins important in the transcriptional regulation of several genes. Although increased expression of the HMG-I/Y proteins is associated with cellular proliferation, neoplastic transformation, and several human cancers, the role of these proteins in the pathogenesis of malignancy remains unclear. To better understand the role of these proteins in cell growth and transformation, we have been studying the regulation and function of HMG-I/Y. The HMG-I/Y promoter was cloned, sequenced, and subjected to mutagenesis analysis. A c-Myc-Max consensus DNA binding site was identified as an element important in the serum stimulation of HMG-I/Y. The oncoprotein c-Myc and its protein partner Max bind to this site in vitro and activate transcription in transfection experiments. HMG-I/Y expression is stimulated by c-Myc in a Myc-estradiol receptor cell line in the presence of the protein synthesis inhibitor cycloheximide, indicating that HMG-I/Y is a direct c-Myc target gene. HMG-I/Y induction is decreased in Myc-deficient fibroblasts. HMG-I/Y protein expression is also increased in Burkitt's lymphoma cell lines, which are known to have increased c-Myc protein. Like Myc, increased expression of HMG-I protein leads to the neoplastic transformation of both Rat 1a fibroblasts and CB33 cells. In addition, Rat 1a cells overexpressing HMG-I protein form tumors in nude mice. Decreasing HMG-I/Y proteins using an antisense construct abrogates transformation in Burkitt's lymphoma cells. These findings indicate that HMG-I/Y is a c-Myc target gene involved in neoplastic transformation and a member of a new class of potential oncogenes.


Figures

FIG. 1
FIG. 1
c-Myc–Max consensus DNA binding site is an important serum- or growth factor-responsive element in the HMG-I/Y promoter. (A) Restriction map of the 5′ noncoding region of the murine HMG-I/Y gene. The transcription start sites, E-box, and AP2 site are indicated. (B) Stimulation of HMG-I/Y promoter sequences by serum, FGF, and PDGF. NIH 3T3 cells were cotransfected with HMG-I/Y-GH- and β-galactosidase-expressing plasmids. Each time point represents the average for four samples; dishes were transfected in duplicate, and two aliquots of medium were taken from each dish at each time point. Error bars indicate standard deviations. Experiments were repeated three to five times with similar results. The GH concentration is expressed in micrograms per milliliter. (C) HMG-I/Y promoter mutational analysis. Progressive 5′ deletion mutations of the HMG-I/Y promoter construct are depicted on the left, and the relative GH activities are shown on the right. The full-length, wild-type promoter construct was assigned an activity of 100%; the activities of the deletion constructs are expressed as a percentage of the wild-type promoter construct activity. Transfections were performed in quadruplicate and repeated three to five times. The solid bar represents the average for three to five experiments; error bars indicate standard deviations. Restriction enzyme site abbreviations: H, HindIII; Sc, SacI; Pf, Pflm; Pm, Pml; Ps, PstI; Bm, BamHI. Ex, site of exonuclease digestion; the numbers are the original clone numbers. Note the significant drop (78%) in relative GH activity between constructs −1476 and −1337. A second decrease in activity is observed between −1308 and −1237. (D) Decreased serum stimulation (60%) of the HMG-I/Y promoter with the E-box mutation (−1896 MT Myc-GH) relative to the wild-type HMG-I/Y promoter (−1896 HMG-I/Y–GH). A control plasmid expressing β-galactosidase and plasmids expressing either −1895 HMG-I/Y–GH or −1896 MT Myc-GH were cotransfected into NIH 3T3 cells. Cells were made quiescent by starvation in 0.1% MEM for 25 to 30 h and subsequently stimulated with 20% FBS for 25 to 30 h. Transfections were performed in quadruplicate, and experiments were repeated five times. The solid bars show the mean values from five different experiments; error bars show the standard deviations. As before, the wild-type promoter construct was assigned an activity of 100%. Note that the E-box mutation decreases the serum responsiveness of the HMG-I/Y promoter by 60%.
FIG. 1
FIG. 1
c-Myc–Max consensus DNA binding site is an important serum- or growth factor-responsive element in the HMG-I/Y promoter. (A) Restriction map of the 5′ noncoding region of the murine HMG-I/Y gene. The transcription start sites, E-box, and AP2 site are indicated. (B) Stimulation of HMG-I/Y promoter sequences by serum, FGF, and PDGF. NIH 3T3 cells were cotransfected with HMG-I/Y-GH- and β-galactosidase-expressing plasmids. Each time point represents the average for four samples; dishes were transfected in duplicate, and two aliquots of medium were taken from each dish at each time point. Error bars indicate standard deviations. Experiments were repeated three to five times with similar results. The GH concentration is expressed in micrograms per milliliter. (C) HMG-I/Y promoter mutational analysis. Progressive 5′ deletion mutations of the HMG-I/Y promoter construct are depicted on the left, and the relative GH activities are shown on the right. The full-length, wild-type promoter construct was assigned an activity of 100%; the activities of the deletion constructs are expressed as a percentage of the wild-type promoter construct activity. Transfections were performed in quadruplicate and repeated three to five times. The solid bar represents the average for three to five experiments; error bars indicate standard deviations. Restriction enzyme site abbreviations: H, HindIII; Sc, SacI; Pf, Pflm; Pm, Pml; Ps, PstI; Bm, BamHI. Ex, site of exonuclease digestion; the numbers are the original clone numbers. Note the significant drop (78%) in relative GH activity between constructs −1476 and −1337. A second decrease in activity is observed between −1308 and −1237. (D) Decreased serum stimulation (60%) of the HMG-I/Y promoter with the E-box mutation (−1896 MT Myc-GH) relative to the wild-type HMG-I/Y promoter (−1896 HMG-I/Y–GH). A control plasmid expressing β-galactosidase and plasmids expressing either −1895 HMG-I/Y–GH or −1896 MT Myc-GH were cotransfected into NIH 3T3 cells. Cells were made quiescent by starvation in 0.1% MEM for 25 to 30 h and subsequently stimulated with 20% FBS for 25 to 30 h. Transfections were performed in quadruplicate, and experiments were repeated five times. The solid bars show the mean values from five different experiments; error bars show the standard deviations. As before, the wild-type promoter construct was assigned an activity of 100%. Note that the E-box mutation decreases the serum responsiveness of the HMG-I/Y promoter by 60%.
FIG. 2
FIG. 2
c-Myc and Max proteins bind specifically to the E-box in the HMG-I/Y promoter and activate transcription. (A) Binding of tMyc, Max, and heterodimers of tMyc and Max to the wild-type probe (WT) containing the core binding sequence CACGTG but not to the mutated E-box probe (MT) containing a double point mutation in the core sequence (CAGCTG). The first four lanes contain WT probe as follows: probe alone or with tMyc, Max, or tMyc and Max, respectively. The next four lanes contain the MT probe as follows: probe alone or with tMyc, Max, or tMyc and Max, respectively. (B) Specificity of binding of tMyc-Max to the WT probe. DNA sequence specificity was tested by comparative competitions with the indicated molar excess of unlabeled WT probe versus MT probe. Lanes contain labeled WT probe and heterodimers of tMyc and Max with no competitor or an increasing molar excess of the unlabeled WT or MT probe. Note that the WT but not the MT probe competes effectively at 2- and 10-fold molar excesses. (C) Plasmids expressing the control vector alone, c-Myc alone, or c-Myc and Max were cotransfected with the HMG-I/Y–GH promoter constructs containing the wild-type but not the mutated E-box HMG-I/Y promoter sequences by over 10-fold. Each bar shows the mean relative GH activity from four samples; error bars indicate the standard deviation. Transfections were performed in growing cells in duplicate, and two aliquots of medium were taken from each dish. Transfections were repeated three times with similar results. Note that c-Myc and Max transactivate the wild-type but not the mutated E-box HMG-I/Y promoter sequences by over 10-fold.
FIG. 2
FIG. 2
c-Myc and Max proteins bind specifically to the E-box in the HMG-I/Y promoter and activate transcription. (A) Binding of tMyc, Max, and heterodimers of tMyc and Max to the wild-type probe (WT) containing the core binding sequence CACGTG but not to the mutated E-box probe (MT) containing a double point mutation in the core sequence (CAGCTG). The first four lanes contain WT probe as follows: probe alone or with tMyc, Max, or tMyc and Max, respectively. The next four lanes contain the MT probe as follows: probe alone or with tMyc, Max, or tMyc and Max, respectively. (B) Specificity of binding of tMyc-Max to the WT probe. DNA sequence specificity was tested by comparative competitions with the indicated molar excess of unlabeled WT probe versus MT probe. Lanes contain labeled WT probe and heterodimers of tMyc and Max with no competitor or an increasing molar excess of the unlabeled WT or MT probe. Note that the WT but not the MT probe competes effectively at 2- and 10-fold molar excesses. (C) Plasmids expressing the control vector alone, c-Myc alone, or c-Myc and Max were cotransfected with the HMG-I/Y–GH promoter constructs containing the wild-type but not the mutated E-box HMG-I/Y promoter sequences by over 10-fold. Each bar shows the mean relative GH activity from four samples; error bars indicate the standard deviation. Transfections were performed in growing cells in duplicate, and two aliquots of medium were taken from each dish. Transfections were repeated three times with similar results. Note that c-Myc and Max transactivate the wild-type but not the mutated E-box HMG-I/Y promoter sequences by over 10-fold.
FIG. 3
FIG. 3
Direct stimulation of HMG-I/Y expression by c-Myc. (A) Northern blot analysis showing HMG-I/Y expression in a cell line expressing Myc-estradiol receptor fusion protein (Myc-ER) following incubation with the estrogen analogue hydroxytamoxifen (HT), HT and the protein synthesis inhibitor cycloheximide (CHX), or CHX alone. The ribosomal protein PO mRNA was used to control for sample loading. PO and the ethidium bromide-stained gel with the 28S and 18S rRNA bands are shown. Note the 30-fold induction of HMG-I/Y expression by 10 to 12 h after incubation in hydroxytamoxifen and activation of c-Myc. HMG-I/Y expression is also stimulated over 30-fold by c-Myc after incubation with HT and CHX for 10 to 12 h, indicating that HMG-I/Y is directly activated by c-Myc in these cells. HMG-I/Y expression changes minimally (1.6- to 2.8-fold) after incubation with cycloheximide alone. (B) Graphic representation of HMG-I/Y induction in Myc-ER cells following incubation with hydroxytamoxifen and cycloheximide. Experiments were repeated three to four times with similar results. The solid bars show the mean values from these experiments; error bars denote the standard deviations. Note that HMG-I/Y increases by over 30-fold after c-Myc activation in the presence of CHX, indicating that HMG-I/Y is a direct c-Myc target gene. (C) Western analysis showing induction of the HMG-I/Y protein after activation of Myc by incubation in hydroxytamoxifen for 8 h in the Myc-ER cells. β-Actin was used as a control for sample loading. (D) Northern analysis showing that HMG-I/Y expression is stimulated threefold following activation of wild-type c-Myc (Myc-ER), but not by a mutated c-Myc (ΔMyc-ER) that lacks transcriptional, transforming, and apoptotic activity in Rat-1 cells expressing the wild-type or mutated Myc-ER proteins. Cells were incubated with hydroxytamoxifen for the indicated time periods (in hours). PO was used to control for sample loading; the positions of human (Hu) PO, 28S, and 18S RNA are shown. (E) HMG-I/Y proteins are increased in Burkitt's lymphoma cells compared to EBV-transformed lymphocytes from healthy individuals. Western blot analysis of HMG-I/Y protein and controls Ki-67 and β-actin in Burkitt's lymphoma cell lines and EBV-transformed B lymphocytes from a healthy individual. Lanes: 1, healthy; 2 to 4, Burkitt's lymphoma cell lines: ST486, Ramos, and DW6, respectively. Note the marked increase in HMG-I/Y proteins in all Burkitt's lymphoma cell lines. (F) HMG-I/Y induction by serum is reduced in myc-null (Myc−/−) fibroblasts (68). Northern analysis showing that HMG-I/Y is stimulated 8.9- to 11.4-fold in wild-type (Myc+/+) fibroblasts, but only 1.6- to 2.7-fold in the Myc-deficient (Myc−/−) cells. (G) Graphic representation of the decreased HMG-I/Y induction in Myc-deficient cells. This experiment was repeated four times with similar results. The solid bars show the mean values from these experiments; error bars denote the standard deviations. These results are consistent with our findings that HMG-I/Y is a direct c-Myc target gene.
FIG. 4
FIG. 4
Rat 1a cells overexpressing HMG-I form colonies in the soft agar assay. (A) Rat 1a cells overexpressing HMG-I (Rat 1a-HMG-I) or c-Myc (Rat 1a-myc) or control Rat 1a cells transfected with the vector alone (Rat 1a pSG5) were subjected to analysis in the soft agar assay. Both Rat 1a-HMG-I and Rat 1a-myc cells formed colonies capable of anchorage-independent growth in the soft agar assay. Bar, 100 μm. (B) Rat 1a-HMG-I and Rat 1a-myc cells exhibit similar cell cycle profiles when grown on top of soft agar. This experiment was repeated three times with similar results. (C) The number of colonies formed by Rat 1a-HMG-I and Rat 1a-myc cells was similar. Assays were performed in duplicate, and the results are taken from two separate experiments. The solid bar represents the mean from two different experiments; the error bars indicate the standard deviation. (D) Rat 1a-HMG-I and Rat 1a-myc cells overexpress HMG-I protein. Western analysis shows that both Rat 1a-HMG-I and Rat 1a-myc cells overexpress HMG-I compared to control Rat 1a cells transfected with pSG5 vector alone. The lanes were blotted with the HMG-I/Y antibody as well as a β-actin antibody to control for sample loading. (E) Cell growth rates of Rat 1a cell lines. This experiment was performed with duplicate plates and repeated twice. The data points represent the average counts from duplicate plates; the error bars depict the standard deviations from a representative experiment. Note that all Rat 1a cell lines grow at similar rates.
FIG. 5
FIG. 5
CB33 cells overexpressing HMG-I form colonies in the soft agar assay. (A) CB33 cells overexpressing HMG-I (CB33-HMG-I) or c-Myc (CB33-Myc) or control CB33 cells transfected with the vector alone (CB33-Control) were subjected to analysis in the soft agar assay. Both CB33-HMG-I and CB33-Myc cells formed colonies capable of anchorage-independent growth in the soft agar assay. (B) The number of colonies formed by the CB33-HMG-I and CB33-Myc cells was similar. Assays were performed in duplicate, and the results are taken from two or three separate experiments. The solid bar represents the mean from two or three different experiments; the error bars indicate the standard deviation. (C) CB33-HMG-I and CB33-Myc cells overexpress HMG-I protein. Western analysis shows that both CB33-HMG-I and CB33-Myc cells overexpress HMG-I compared to control CB33 cells transfected with vector alone. The lanes were blotted with the HMG-I/Y antibody as well as a β-actin antibody to control for sample loading. (D) Growth rates of the CB33 cell lines. This experiment was performed with quadruplicate cell counts taken per time period. The data points represent the average counts from two separate experiments; the error bars depict the standard deviations. Note that all CB33 cell lines grow at similar rates.
FIG. 6
FIG. 6
Rat 1a-HMG-I cells form tumors in nude mice. (A) Rat 1a-HMG-I, Rat 1a-myc, and control Rat 1a-pSG5 cells were injected into nude mice. Only mice injected with Rat 1a cells overexpressing HMG-I or c-Myc formed tumors. This photograph shows a representative mouse injected with Rat 1a-HMG-I cells. (B) Pathologic evaluation of the tumors showed that all tumors formed from Rat 1a-HMG-I or Rat 1a-myc cells were fibrosarcomas. This photograph shows a 12× magnification of the large subcutaneous tumor in a mouse injected with Rat 1a-HMG-I cells (H & E). (C) Tumor at 300× magnification. Note the bundles of spindle-shaped cells (H & E). (D) Characteristics of tumors from nude mice injected with Rat 1a-HMG-I and Rat 1a-myc cells.
FIG. 7
FIG. 7
Decreasing HMG-I/Y protein level inhibits Myc-mediated transformation in Burkitt's lymphoma cells. (A) Western blot of Burkitt's lymphoma cells (Ramos) transfected with the antisense ribozyme construct or the vector control. Note the marked, specific decrease in HMG-I/Y proteins in cells transfected with the antisense HMG-I construct. HMG-C protein was unaffected. (B) Transformation in soft agar in Burkitt's cells is abrogated by decreasing HMG-I/Y protein levels. The soft agar assay was performed in quadruplicate. The number of foci and the standard deviations were taken from three different experiments. (C) Growth rates of Burkitt's lymphoma cells transfected with control vector or the HMG-I antisense vector. Note the decreased growth rate of the Burkitt's lymphoma cells with decreased HMG-I/Y protein levels.

Similar articles

Cited by

References

    1. Abate C, Luk D, Gentz R, Rauscher III F J, Curran T. Expression and purification of the leucine zipper and DNA-binding domains of Fos and Jun: both Fos and Jun contact DNA directly. Proc Natl Acad Sci USA. 1990;87:1032–1036. - PMC - PubMed
    1. Amin C A, Wagner J, Hay N. Sequence-specific transcriptional activation by Myc and repression by Max. Mol Cell Biol. 1993;13:383–390. - PMC - PubMed
    1. Ausubel F M, Brent R, Kingston R E, Moore D D, Seidman J G, Smith J A, Struhl K. Current protocols in molecular biology. New York, N.Y: John Wiley & Sons; 1990.
    1. Auvinen M, Laine A, Paasinen-Sohns A, Kangas A, Kangas L, Saksela O, Andersson L C, Holtta E. Human ornithine decarboxylase-overproducing NIH3T3 cells induce rapidly growing, highly vascularized tumors in nude mice. Cancer Res. 1997;57:3016–3025. - PubMed
    1. Auvinen M, Paasinen A, Andersson L C, Holtta E. Ornithine decarboxylase activity is critical for cell transformation. Nature. 1992;360:355–358. - PubMed

Publication types

MeSH terms

LinkOut - more resources