Fundamental patterns underlying gene expression profiles: simplicity from complexity
- PMID: 10890920
- PMCID: PMC26961
- DOI: 10.1073/pnas.150242097
Fundamental patterns underlying gene expression profiles: simplicity from complexity
Abstract
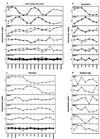
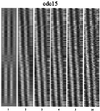
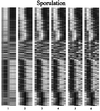
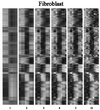
Analysis of previously published sets of DNA microarray gene expression data by singular value decomposition has uncovered underlying patterns or "characteristic modes" in their temporal profiles. These patterns contribute unequally to the structure of the expression profiles. Moreover, the essential features of a given set of expression profiles are captured using just a small number of characteristic modes. This leads to the striking conclusion that the transcriptional response of a genome is orchestrated in a few fundamental patterns of gene expression change. These patterns are both simple and robust, dominating the alterations in expression of genes throughout the genome. Moreover, the characteristic modes of gene expression change in response to environmental perturbations are similar in such distant organisms as yeast and human cells. This analysis reveals simple regularities in the seemingly complex transcriptional transitions of diverse cells to new states, and these provide insights into the operation of the underlying genetic networks.
Figures
Similar articles
-
Statistical inference of transcriptional module-based gene networks from time course gene expression profiles by using state space models.Bioinformatics. 2008 Apr 1;24(7):932-42. doi: 10.1093/bioinformatics/btm639. Epub 2008 Feb 21. Bioinformatics. 2008. PMID: 18292116
-
Detecting biological associations between genes based on the theory of phase synchronization.Biosystems. 2008 May;92(2):99-113. doi: 10.1016/j.biosystems.2007.12.006. Epub 2008 Jan 11. Biosystems. 2008. PMID: 18289772
-
Genome-wide prediction of transcriptional regulatory elements of human promoters using gene expression and promoter analysis data.BMC Bioinformatics. 2006 Jul 4;7:330. doi: 10.1186/1471-2105-7-330. BMC Bioinformatics. 2006. PMID: 16817975 Free PMC article.
-
Dynamic models of gene expression and classification.Funct Integr Genomics. 2001 Mar;1(4):269-78. doi: 10.1007/s101420000035. Funct Integr Genomics. 2001. PMID: 11793246
-
Identifying regulatory networks by combinatorial analysis of promoter elements.Nat Genet. 2001 Oct;29(2):153-9. doi: 10.1038/ng724. Nat Genet. 2001. PMID: 11547334
Cited by
-
Postmortem cardiac tissue maintains gene expression profile even after late harvesting.BMC Genomics. 2012 Jan 17;13:26. doi: 10.1186/1471-2164-13-26. BMC Genomics. 2012. PMID: 22251372 Free PMC article.
-
Selection and validation of endogenous reference genes for qRT-PCR analysis in leafy spurge (Euphorbia esula).PLoS One. 2012;7(8):e42839. doi: 10.1371/journal.pone.0042839. Epub 2012 Aug 14. PLoS One. 2012. PMID: 22916167 Free PMC article.
-
Effects of resveratrol on gene expression in renal cell carcinoma.Cancer Biol Ther. 2004 Sep;3(9):882-8. doi: 10.4161/cbt.3.9.1056. Epub 2004 Sep 21. Cancer Biol Ther. 2004. PMID: 15280659 Free PMC article.
-
Genetic and nongenetic variation revealed for the principal components of human gene expression.Genetics. 2013 Nov;195(3):1117-28. doi: 10.1534/genetics.113.153221. Epub 2013 Sep 11. Genetics. 2013. PMID: 24026092 Free PMC article.
-
Understanding health and disease with multidimensional single-cell methods.J Phys Condens Matter. 2014 Feb 19;26(7):073102. doi: 10.1088/0953-8984/26/7/073102. Epub 2014 Jan 22. J Phys Condens Matter. 2014. PMID: 24451406 Free PMC article. Review.
References
-
- Schena M, Shalon D, Davis R W, Brown P O. Science. 1995;270:467–470. - PubMed
-
- Iyer V R, Eisen M B, Ross D T, Schuler G, Moore T, Lee J C F, Trent J M, Staudt L M, Hudson J, Jr, Boguski M S, et al. Science. 1999;283:83–87. - PubMed
-
- Chu S, DeRisi J, Eisen M, Mulholland J, Botstein D, Brown P O, Herskowitz I. Science. 1998;282:699–705. - PubMed
Publication types
MeSH terms
Substances
LinkOut - more resources
Full Text Sources
Other Literature Sources
Molecular Biology Databases

