. 2000 Jul 3;19(13):3496-506.
doi: 10.1093/emboj/19.13.3496.

Limited overlapping roles of P15(INK4b) and P18(INK4c) cell cycle inhibitors in proliferation and tumorigenesis

Affiliations

Limited overlapping roles of P15(INK4b) and P18(INK4c) cell cycle inhibitors in proliferation and tumorigenesis

E Latres et al. EMBO J. .

Abstract

Entry of quiescent cells into the cell cycle is driven by the cyclin D-dependent kinases Cdk4 and Cdk6. These kinases are negatively regulated by the INK4 cell cycle inhibitors. We report the generation of mice defective in P15(INK4b) and P18(INK4c). Ablation of these genes, either alone or in combination, does not abrogate cell contact inhibition or senescence of mouse embryo fibroblasts in culture. However, loss of P15(INK4b), but not of P18(INK4c), confers proliferative advantage to these cells and makes them more sensitive to transformation by H-ras oncogenes. In vivo, ablation of P15(INK4b) and P18(INK4c) genes results in lymphoproliferative disorders and tumor formation. Mice lacking P18(INK4c) have deregulated epithelial cell growth leading to the formation of cysts, mostly in the cortical region of the kidneys and the mammary epithelium. Loss of both P15(INK4b) and P18(INK4c) does not result in significantly distinct phenotypic manifestations except for the appearance of cysts in additional tissues. These results indicate that P15(INK4b) and P18(IKN4c) are tumor suppressor proteins that act in different cellular lineages and/or pathways with limited compensatory roles.


Figures

None
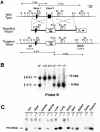
Fig. 1. Generation of P15INK4b (–/–) mutant mice. (A) Schematic diagram of the targeting strategy. Top: partial restriction map of wild-type 129/Sv genomic DNA encompassing the two coding exons of the P15INK4b locus (filled boxes) (B, BamHI; E, EcoRI; EV, EcoRV; N, NotI; Xb, XbaI; Xh, XhoI). Middle: the targeting vector, pEL14, contains the PGK-neo (open box, neo) and PGK-thymidine kinase (open box, tk) cassettes. The arrows indicates the direction of transcription. Bottom: schematic diagram of the predicted targeting allele resulting from a homologous recombination event between wild-type DNA and the targeting vector. Sequences used for Southern blot analysis of recombinant ES cell clones (probes A and B) are indicated by stippled boxes. Probe A recognizes XbaI DNA fragments of 22 kbp (wild-type allele) and 11.4 kbp (targeted allele). Probe B detects BamHI DNA fragments of 12 kbp (wild-type allele) and 15.5 kbp (targeted allele). (B) Southern blot analysis of mouse tail DNA isolated from newborn mice derived from crosses between P15INK4b (+/–) mice and hybridized to probe B. The migration of the BamHI DNA fragments derived from wild-type (+/+) and targeted (–/–) alleles is indicated. The corresponding genotype of each mouse is indicated on top. (C) Left: immunoprecipitation of MEFs derived from wild-type (+/+) or P15INK4b (–/–) embryos with anti-P15INK4b antibodies. Right: western blot analysis of Cdk4 immunoprecipitates with anti-P15INK4b antibodies. The migration of the P15INK4b protein is indicated by arrows.
None
Fig. 2. Generation of P18INK4c (–/–) mice. (A) Targeting strategy. Top: partial restriction map of wild-type 129/Sv genomic DNA encompassing the two coding exons (filled boxes) of the P18INK4c gene (B, BamHI; E, EcoRI; EV, EcoRV; H, HindIII; N, NotI; Xa, XbaI; Xh, XhoI). Middle: the targeting vector, pEL32, contains the PGK-neo (open box, neo) and PGK-thymidine kinase (open box, tk) cassettes. The PGK-neo cassette has replaced 1.4 kbp of P18INK4c genomic sequences that encompass the entire second exon (E2). The arrows indicate the direction of transcription. Bottom: schematic diagram of the predicted structure of a targeted allele resulting from homologous recombination between wild-type sequences and the targeting vector. Sequences used for Southern blot analysis of recombinant ES cell clones (probes A and B) are indicated by stippled boxes. Probe A recognizes EcoRV DNA fragments of 13 kbp (wild-type allele) and 8 kbp (targeted allele). Probe B detects EcoRI DNA fragments of 7 kbp (wild-type allele) and 9 kbp (targeted allele). (B) Southern blot analysis of mouse tail DNA derived from crosses between P18INK4c (+/–) mice using probe B. The migration of the EcoRV DNA fragments is indicated by arrows. The corresponding genotype of each mouse is indicated on top. (C) Immunoprecipitation followed by western blot analysis of tissues derived from 3-month-old P18INK4c (+/+) and (–/–) mice. The migration of the P18INK4c protein is indicated by an arrow.
None
Fig. 3. Growth properties of MEFs derived from P15INK4, P18INK4c and P15INK4b;P18INK4c mutant mice. (A) Growth curves: four independent cultures of early passage (P2) wild type (filled triangles); P15INK4b (–/–) (open circles); P18INK4c (–/–) (filled circles) and P15INK4b;P18INK4c [(–/–);(–/–)] (open squares) MEFs were cultured using a standard 3T3 protocol. (B) Plating efficiency: 2000 cells were seeded in a 10 cm plate and colonies scored after 2 weeks in culture. (C) Re-entry into S phase after serum deprivation: MEFs were starved in 0.1% FBS for 48 h prior to incubation with 10% FBS (0 h) for the indicated lengths of time in the presence of BrdU. Symbols are as described in (A).
None
Fig. 4. Morphological transformation of mutant MEFs by H-ras and c-myc oncogenes. (A) The histogram shows the average number of foci per 10 cm plate and the standard deviation obtained by transfection of MEFs derived from wild-type; P15INK4b (–/–); P18INK4c (–/–) and P15INK4b;P18INK4c [(–/–);(–/–)] embryos with an empty vector (open box); a plasmid containing a human H-ras oncogene (dotted box); a plasmid containing an SV40-driven mouse c-myc oncogene (stippled box); or a combination of each of these oncogene-containing plasmids (filled box). The results shown are the average of at least four separate experiments carried out with MEF cultures derived from at least five different embryos for each genotype. (B) A representative experiment in which MEFs derived from the indicated embryos were transfected with a plasmid containing the H-ras oncogene. Plates were stained with methylene blue after 15 days in culture. (C) Morphological appearance of representative foci obtained in the transfection of P15INK4b-deficient MEFs with plasmids expressing H-ras alone (left) or both H-ras and c-myc (right).
None
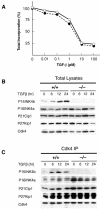
Fig. 5. Effect of TGF-β on mouse cells lacking P15INK4b. (A) Inhibitory growth effect of TGF-β on cultured keratinocytes derived from wild-type (filled circles) or P15INK4b (–/–) mice (open circles). Serial dilutions of TGF-β (0.01–100 pM range) were added to cells 5 days after plating. At 22 h after addition of TGF-β, cells were pulsed with [3H]thymidine for 1 h. (B) Expression levels of P15INK4b, P16INK4a, P21Cip1 and P27Kip1 cell cycle inhibitory proteins in wild-type (+/+) and P15INK4b (–/–)-deficient MEFs treated with TGF-β (100 pM) for the times indicated. (C) Levels of P15INK4b, P16INK4a, P21Cip1 and P27Kip1 proteins bound to Cdk4 in MEFs treated with TGF-β for the times indicated.
None
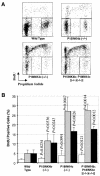
Fig. 6. Lymphocyte proliferation in P15INK4b and P18INK4c mutant mice. (A) Representative BrdU/propidium iodide plots showing lymphocyte activation after PMA + ionomycin treatment. (B) Bars show the average levels of BrdU incorporation and the standard deviation of duplicate experiments using cells from four different mice of each genotype untreated (open bars) or treated with PMA + ionomycin (shaded bars) or concanavalin A (filled bars). The proliferation of the mutant lymphocytes was compared with that of wild-type cells with identical treatment using the Student t-test.
None
Fig. 7. Representative phenotypic abnormalities of P15INK4b (–/–), P18INK4c (–/–) and P15INK4b;P18INK4c [(–/–);(–/–)] mutant mice. (A and B) P15INK4b (–/–) mice. Histological analysis of (A) extramedullar hematopoiesis in the spleen and (B) secondary follicles in mesenteric lymph nodes of 12-week-old P15INK4b null animals. (C and DP18INK4c (–/–) mice. Histological analysis of cysts (C) in the cortical region of the kidney and (D) in the galactophor ducts of the mammary epithelium of 12-week-old P18INK4b null animals. (E and F) P15INK4b;P18INK4c [(–/–);(–/–)] mice. Histological analysis of (E) a Leydig cell tumor of a 12-month-old mouse and (F) hyperplasia and cysts in pancreatic Langerhans islets of a 14-month-old mouse. None of these abnormalities were found in any of the wild-type mice examined. Arrows indicate the presence of (B) secondary germinal centers and (C, D and F) cystic structures. (E) Asterisks indicate residual seminiferous tubes. Original magnification is 100× (A, B and F), 200× (C) and 50× (D and E).

Similar articles

Cited by

References

    1. Blain S.W., Montalvo,E. and Massagué,J. (1997) Differential interaction of the cyclin-dependent kinase (Cdk) inhibitor p27Kip1 with cyclin A–Cdk2 and cyclin D2–Cdk4. J. Biol. Chem., 272, 25863–25872. - PubMed
    1. Cheng M., Olivier,P., Diehl,J.A., Fero,M., Roussel,M.F., Roberts,J.M. and Sherr,C.J. (1999) The p21Cip1 and p27Kip1 CDK ‘inhibitors’ are essential activators of cyclin D-dependent kinases in murine fibroblasts. EMBO J., 18, 1571–1583. - PMC - PubMed
    1. Deng C., Zhang,P., Harper,J.W., Elledge,S.J. and Leder,P. (1995) Mice lacking p21CIP1/WAF1 undergo normal development, but are defective in G1 checkpoint control. Cell, 82, 675–684. - PubMed
    1. Franklin D.S. and Xiong,Y. (1996) Induction of P18INK4c and its predominant association with CDK4 and CDK6 during myogenic differentiation. Mol. Biol. Cell, 7, 1587–1599. - PMC - PubMed
    1. Franklin D.S., Godfrey,V.L., Lee,H., Kovalev,G.I., Schoonhoven,R., Chen-Kiang,S., Su,L. and Xiong,Y. (1998) CDK inhibitors p18INK4c and p27Kip1 mediate two separate pathways to collaboratively suppress pituitary tumorigenesis. Genes Dev., 12, 2899–2911. - PMC - PubMed

Publication types

MeSH terms