Possible association of BLM in decreasing DNA double strand breaks during DNA replication
- PMID: 10880455
- PMCID: PMC313960
- DOI: 10.1093/emboj/19.13.3428
Possible association of BLM in decreasing DNA double strand breaks during DNA replication
Abstract
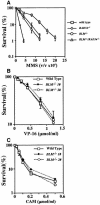
Bloom's syndrome (BS) is a rare genetic disorder and the cells from BS patients show genomic instability and an increased level of sister chromatid exchange (SCE). We generated BLM(-/-) and BLM(-/-)/RAD54(-/-) DT40 cells from the chicken B-lymphocyte line DT40. The BLM(-/-) DT40 cells showed higher sensitivity to methyl methanesulfonate and elevated levels of SCE as expected. The targeted integration frequency was also increased remarkably in BLM(-/-) cells. The SCE frequency increase in BLM(-/-) cells was considerably reduced and the enhanced targeted integration observed in BLM(-/-) cells was almost completely abolished in BLM(-/-)/RAD54(-/-) cells, indicating that a large portion of the SCE in BLM(-/-) cells occurs via homologous recombination, and homologous recombination events increase with the defect of BLM function. The BLM(-/-)/RAD54(-/-) cells showed a slow growth phenotype and an increased incidence of chromosome-type breaks/gaps while each single mutant showed relatively small numbers of chromosome-type breaks/gaps.
Figures


Similar articles
-
Werner and Bloom helicases are involved in DNA repair in a complementary fashion.Oncogene. 2002 Jan 31;21(6):954-63. doi: 10.1038/sj.onc.1205143. Oncogene. 2002. PMID: 11840341
-
Bloom helicase is involved in DNA surveillance in early S phase in vertebrate cells.Oncogene. 2001 Mar 8;20(10):1143-51. doi: 10.1038/sj.onc.1204195. Oncogene. 2001. PMID: 11313858
-
BLM helicase-dependent transport of p53 to sites of stalled DNA replication forks modulates homologous recombination.EMBO J. 2003 Mar 3;22(5):1210-22. doi: 10.1093/emboj/cdg114. EMBO J. 2003. PMID: 12606585 Free PMC article.
-
Role of the BLM helicase in replication fork management.DNA Repair (Amst). 2007 Jul 1;6(7):936-44. doi: 10.1016/j.dnarep.2007.02.007. Epub 2007 Mar 23. DNA Repair (Amst). 2007. PMID: 17363339 Review.
-
Functions of RecQ family helicases: possible involvement of Bloom's and Werner's syndrome gene products in guarding genome integrity during DNA replication.J Biochem. 2001 Apr;129(4):501-7. doi: 10.1093/oxfordjournals.jbchem.a002883. J Biochem. 2001. PMID: 11275547 Review.
Cited by
-
Improved Genome Editing through Inhibition of FANCM and Members of the BTR Dissolvase Complex.Mol Ther. 2021 Mar 3;29(3):1016-1027. doi: 10.1016/j.ymthe.2020.10.020. Epub 2020 Oct 22. Mol Ther. 2021. PMID: 33678249 Free PMC article.
-
A minimal threshold of FANCJ helicase activity is required for its response to replication stress or double-strand break repair.Nucleic Acids Res. 2018 Jul 6;46(12):6238-6256. doi: 10.1093/nar/gky403. Nucleic Acids Res. 2018. PMID: 29788478 Free PMC article.
-
Werner protein cooperates with the XRCC4-DNA ligase IV complex in end-processing.Biochemistry. 2008 Jul 15;47(28):7548-56. doi: 10.1021/bi702325t. Epub 2008 Jun 18. Biochemistry. 2008. PMID: 18558713 Free PMC article.
-
RTEL1 contributes to DNA replication and repair and telomere maintenance.Mol Biol Cell. 2012 Jul;23(14):2782-92. doi: 10.1091/mbc.E12-03-0179. Epub 2012 May 16. Mol Biol Cell. 2012. PMID: 22593209 Free PMC article.
-
BLM helicase stimulates the ATPase and chromatin-remodeling activities of RAD54.J Cell Sci. 2009 Sep 1;122(Pt 17):3093-103. doi: 10.1242/jcs.051813. Epub 2009 Aug 11. J Cell Sci. 2009. PMID: 19671661 Free PMC article.
References
-
- Bennett R.J., Sharp,J.A. and Wang,J.C. (1998) Purification and characterization of the Sgs1 DNA helicase activity of Saccharomyces cerevisiae. J. Biol. Chem., 273, 9644–9650. - PubMed
-
- Bennett R.J., Keck,J.L. and Wang,J.C. (1999) Binding specificity determines polarity of DNA unwinding by the Sgs1 protein of S. cerevisiae. J. Mol. Biol., 289, 235–248. - PubMed
-
- Bezzubova O., Silbergleit,A., Yamaguchi-Iwai,Y., Takeda,S. and Buerstedde,J.M. (1997) Reduced X-ray resistance and homologous recombination frequencies in a Rad54–/– mutant of the chicken DT40 cell line. Cell, 89, 185–193. - PubMed
-
- Cleaver J.E. (1981) Correlations between sister chromatid exchange frequencies and replicon sizes. A model for the mechanism of SCE production. Exp. Cell Res., 136, 27–30. - PubMed
Publication types
MeSH terms
Substances
LinkOut - more resources
Full Text Sources

