An essential intermediate in the folding of dihydrofolate reductase
- PMID: 10811909
- PMCID: PMC18525
- DOI: 10.1073/pnas.100547697
An essential intermediate in the folding of dihydrofolate reductase
Abstract
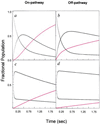
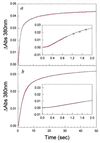
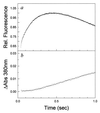
The folding of Escherichia coli dihydrofolate reductase was examined at pH 7.8 and 15 degrees C by using stopped-flow fluorescence and absorbance spectroscopies. The formation of a highly fluorescent intermediate occurs with relaxation times ranging between 142 and 343 msec, whereas stopped-flow absorbance spectroscopy using methotrexate binding assays shows a distinct lag phase during these time frames for the native state. The lag in absorbance kinetics and the lack of fast-track folding events indicate that the formation of this ensemble of intermediates is an obligatory step in the folding reaction.
Figures


Similar articles
-
Refolding of [6-19F]tryptophan-labeled Escherichia coli dihydrofolate reductase in the presence of ligand: a stopped-flow NMR spectroscopy study.Biochemistry. 1998 Jan 6;37(1):387-98. doi: 10.1021/bi971962u. Biochemistry. 1998. PMID: 9425060
-
Highly divergent dihydrofolate reductases conserve complex folding mechanisms.J Mol Biol. 2002 Jan 11;315(2):193-211. doi: 10.1006/jmbi.2001.5230. J Mol Biol. 2002. PMID: 11779239
-
A reexamination of the folding mechanism of dihydrofolate reductase from Escherichia coli: verification and refinement of a four-channel model.Biochemistry. 1993 Apr 13;32(14):3783-9. doi: 10.1021/bi00065a034. Biochemistry. 1993. PMID: 8466916
-
Is dihydropteridine reductase an anomalous dihydrofolate reductase, a flavin-like enzyme, or a short-chain dehydrogenase?Adv Exp Med Biol. 1993;338:115-21. doi: 10.1007/978-1-4615-2960-6_23. Adv Exp Med Biol. 1993. PMID: 8304093 Review. No abstract available.
-
[Folding elements: an essential unit of foldability revealed by systematic circular permutation analysis].Seikagaku. 2001 Jan;73(1):42-6. Seikagaku. 2001. PMID: 11244742 Review. Japanese. No abstract available.
Cited by
-
How synonymous mutations alter enzyme structure and function over long timescales.Nat Chem. 2023 Mar;15(3):308-318. doi: 10.1038/s41557-022-01091-z. Epub 2022 Dec 5. Nat Chem. 2023. PMID: 36471044 Free PMC article.
-
The folding pathway of T4 lysozyme: an on-pathway hidden folding intermediate.J Mol Biol. 2007 Jan 19;365(3):881-91. doi: 10.1016/j.jmb.2006.10.048. Epub 2006 Oct 21. J Mol Biol. 2007. PMID: 17097105 Free PMC article.
-
Cotranslational folding allows misfolding-prone proteins to circumvent deep kinetic traps.Proc Natl Acad Sci U S A. 2020 Jan 21;117(3):1485-1495. doi: 10.1073/pnas.1913207117. Epub 2020 Jan 7. Proc Natl Acad Sci U S A. 2020. PMID: 31911473 Free PMC article.
-
How native-state topology affects the folding of dihydrofolate reductase and interleukin-1beta.Proc Natl Acad Sci U S A. 2000 May 23;97(11):5871-6. doi: 10.1073/pnas.100547897. Proc Natl Acad Sci U S A. 2000. PMID: 10811910 Free PMC article.
-
The Right-Handed Parallel β-Helix Topology of Erwinia chrysanthemi Pectin Methylesterase Is Intimately Associated with Both Sequential Folding and Resistance to High Pressure.Biomolecules. 2021 Jul 22;11(8):1083. doi: 10.3390/biom11081083. Biomolecules. 2021. PMID: 34439750 Free PMC article.
References
-
- Blackburn G M, Jencks W P. J Am Chem Soc. 1968;90:2638–2645.
-
- Robinson D R. J Am Chem Soc. 1970;92:3138–3146.
-
- Cunningham B A, Schmir G L. J Am Chem Soc. 1966;88:551–558.
-
- Baldwin R L. J Biomol NMR. 1995;5:103–109. - PubMed
-
- Socci N D, Onuchic J N, Wolynes P G. Proteins Struct Funct Genet. 1998;32:136–158. - PubMed
Publication types
MeSH terms
Substances
Grants and funding
LinkOut - more resources
Full Text Sources

