. 2000 Apr 17;191(8):1269-80.
doi: 10.1084/jem.191.8.1269.

The role of virus-specific CD8(+) cells in liver damage and viral control during persistent hepatitis B virus infection

Affiliations

The role of virus-specific CD8(+) cells in liver damage and viral control during persistent hepatitis B virus infection

M K Maini et al. J Exp Med. .

Abstract

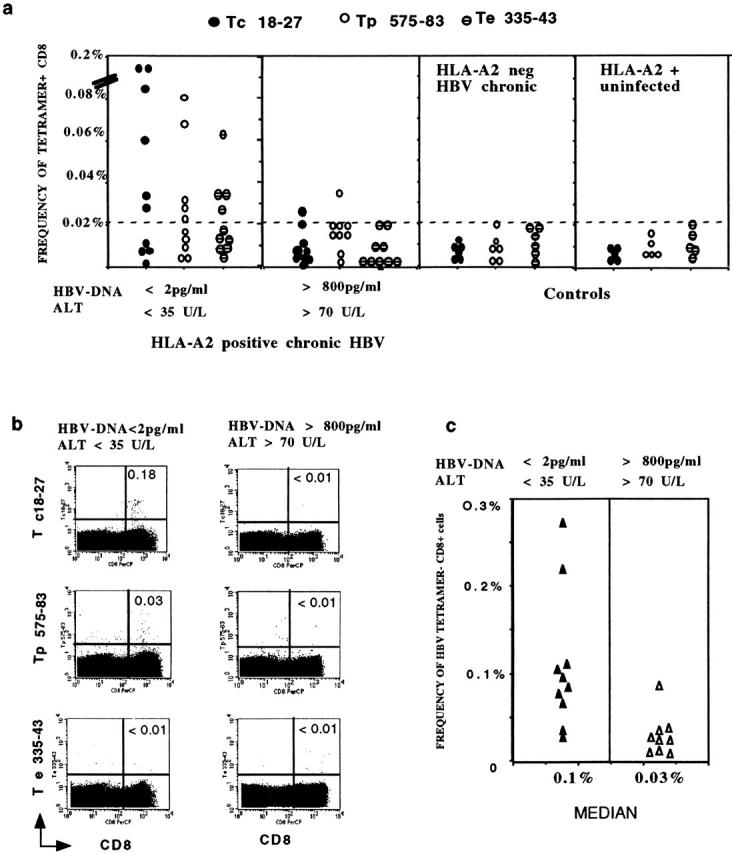
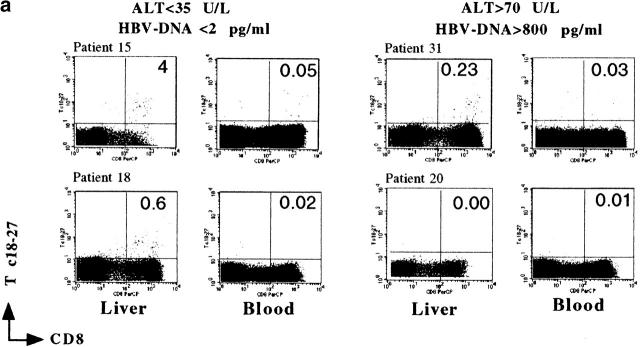
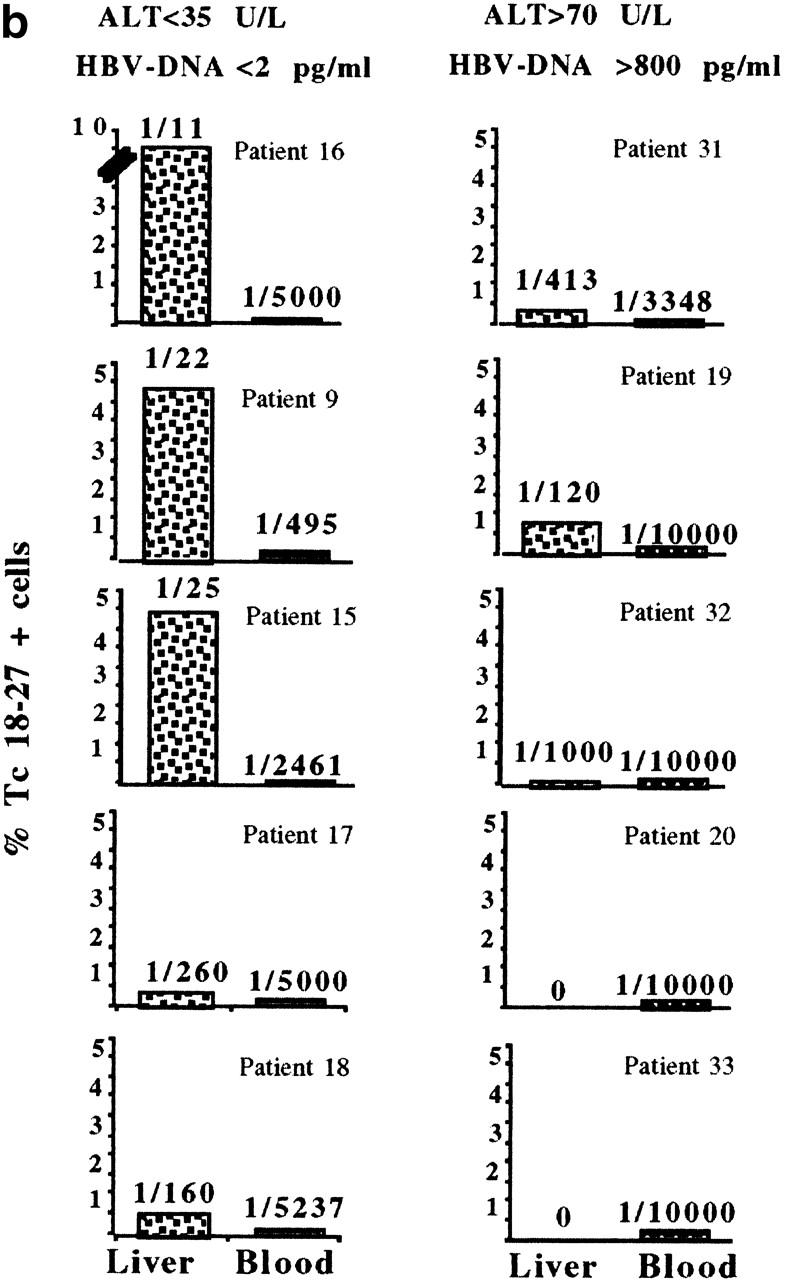
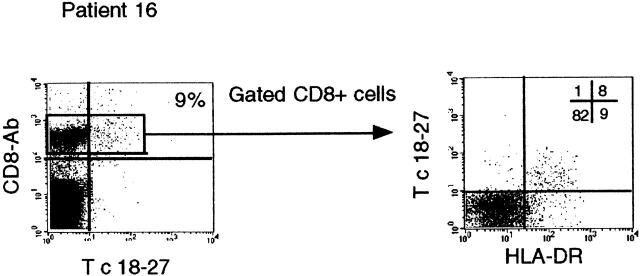
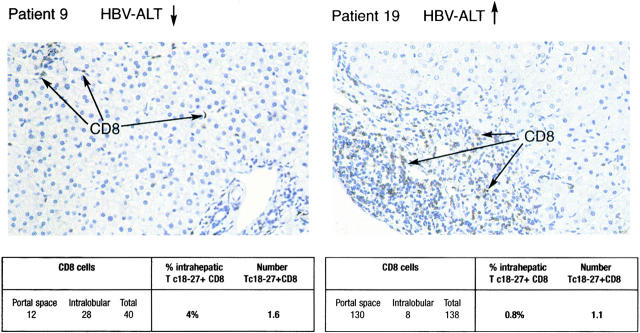
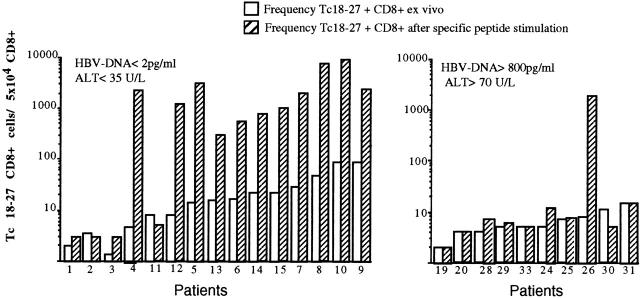
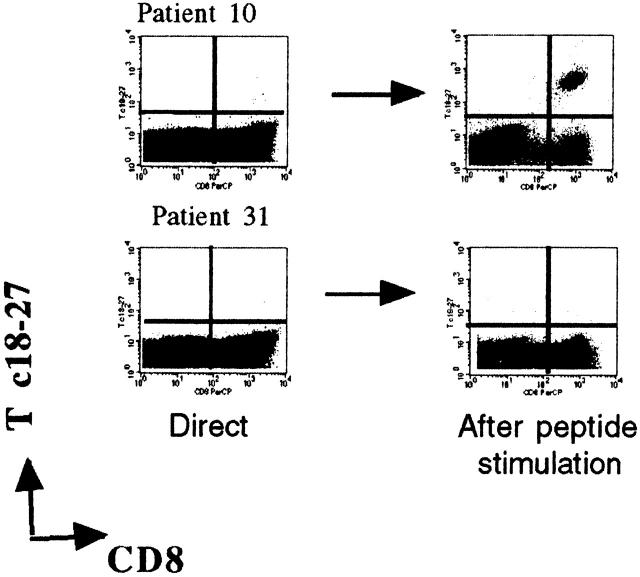
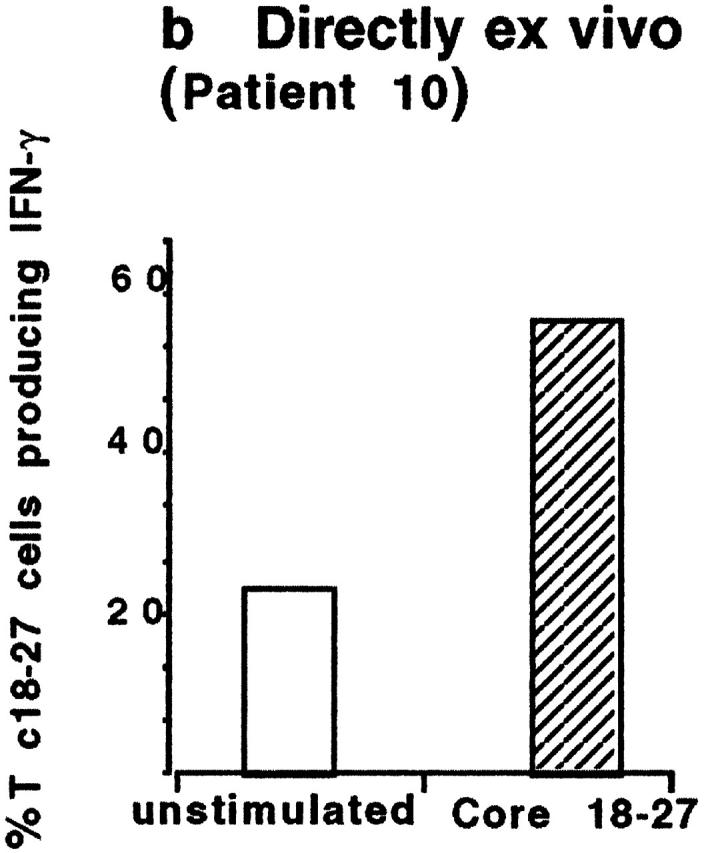
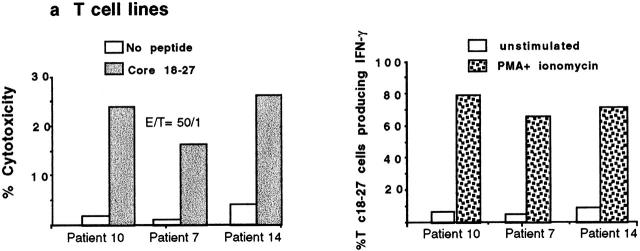
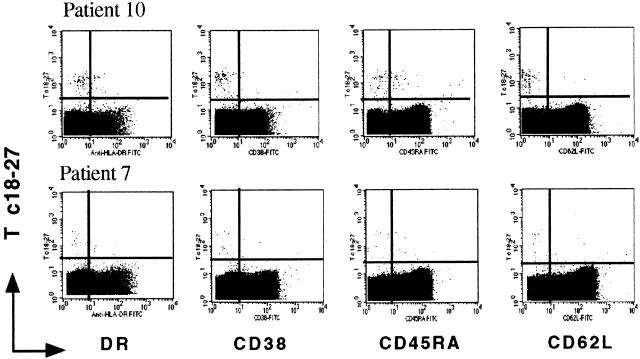
Hepatitis B virus (HBV) is a noncytopathic virus, and the recognition of infected hepatocytes by HBV-specific CD8 cells has been assumed to be the central mechanism causing both liver damage and virus control. To understand the role of cytotoxic T cells in the pathogenesis of HBV infection, we used functional assays that require T cell expansion in vitro and human histocompatibility leukocyte antigen (HLA)-peptide tetramers that allow direct ex vivo quantification of circulating and liver-infiltrating HBV-specific CD8 cells. Two groups of patients with persistent HBV infection were studied: one without liver inflammation and HBV replication, the other with liver inflammation and a high level of HBV replication. Contrary to expectation, a high frequency of intrahepatic HBV-specific CD8 cells was found in the absence of hepatic immunopathology. In contrast, virus-specific T cells were more diluted among liver infiltrates in viremic patients, but their absolute number was similar because of the massive cellular infiltration. Furthermore, inhibition of HBV replication was associated with the presence of a circulating reservoir of CD8(+) cells able to expand after specific virus recognition that was not detectable in highly viremic patients with liver inflammation. These results show that in the presence of an effective HBV-specific CD8 response, inhibition of virus replication can be independent of liver damage. When the HBV-specific CD8 response is unable to control virus replication, it may contribute to liver pathology not only directly but by causing the recruitment of nonvirus-specific T cells.


Figures

Figure 1
Figure 1
Quantification of tetramer+ CD8 cells in the circulation. (a) PBMCs from the two groups of A2+, HBV-infected patients were stained with HBV tetramers (Tc 18–27, Tp 575–583, Te 335–343) and anti-CD8 mAb immediately after isolation. The frequency of tetramer+ CD8 cells was calculated out of 50,000 CD8 cells analyzed. Results obtained in control patients (A2 patients chronically infected by HBV and A2+ HBV-uninfected subjects) are also shown. (b) FACScan™ dot plots of PBMCs stained with anti-CD8 mAb and the indicated HBV tetramers. The numbers in the upper right quadrants indicate the percent of tetramer+ cells out of total CD8 cells, calculated with CELLQuest™ software. (c) The total frequency of Tc 18–27, Tp 575–583, and Te 335–343 positive cells out of 50,000 CD8 cells was calculated. Results for the two groups of patients are presented. The sum of the frequency of tetramer+ cells for Tc 18–27, Tp 575–583, and Te 335–343 was significantly higher in the HBV-ALT↓ group (P < 0.01, Mann Whitney U test).
Figure 2
Figure 2
Preferential sequestration of Tc 18–27+ CD8 cells in the liver compartment. (a) Visualization of liver-infiltrating and circulating core 18–27-specific CD8+ cells by tetramer staining. Dot plots show live gated cells obtained from liver or blood of the indicated patients. a shows representative FACS® plots from two patients from each group, as indicated. Because of the differing yields of liver-infiltrating cells, total numbers of gated cells varied but were always >104 CD8 cells. Numbers in the upper right quadrants indicate the percentage of Tc18–27 CD8+ cells within the total CD8 population. (b) Frequencies of liver and circulating Tc 18–27+ CD8 cells assessed by flow cytometric analysis as illustrated in a are shown. Bars represent the percentage of Tc 18–27+ CD8 cells out of total CD8 cells. The numbers on top of the bars represent the ratio of Tc 18–27+ CD8 to total CD8+ cells.
Figure 2
Figure 2
Preferential sequestration of Tc 18–27+ CD8 cells in the liver compartment. (a) Visualization of liver-infiltrating and circulating core 18–27-specific CD8+ cells by tetramer staining. Dot plots show live gated cells obtained from liver or blood of the indicated patients. a shows representative FACS® plots from two patients from each group, as indicated. Because of the differing yields of liver-infiltrating cells, total numbers of gated cells varied but were always >104 CD8 cells. Numbers in the upper right quadrants indicate the percentage of Tc18–27 CD8+ cells within the total CD8 population. (b) Frequencies of liver and circulating Tc 18–27+ CD8 cells assessed by flow cytometric analysis as illustrated in a are shown. Bars represent the percentage of Tc 18–27+ CD8 cells out of total CD8 cells. The numbers on top of the bars represent the ratio of Tc 18–27+ CD8 to total CD8+ cells.
Figure 3
Figure 3
Phenotypic analysis of liver-infiltrating Tc 18–27+ CD8 cells. Intrahepatic Tc 18–27+ CD8 cells of patient 16 were analyzed by three-color flow cytometry using the PE-conjugated Tc 18–27, cychrome-conjugated anti-CD8, and the FITC-conjugated anti–HLA-DR. The number in the upper right quadrant of the first dot plot indicates the percentage of Tc 18–27 CD8+ within the total CD8 population. The grid in the second dot plot shows the percentage of CD8+ cells in each quadrant.
Figure 4
Figure 4
Analysis of liver-infiltrating CD8 cells. Liver biopsies from patient 9 (HBV DNA <2 pg/ml, ALT <35 U/liter) and patient 19 (HBV DNA 1221 pg/ml, ALT 70 U/liter) were stained with anti-CD8 mAbs. The distribution of CD8+ T lymphocytes in the liver was visualized by immunostaining in formalin-fixed, paraffin-embedded liver specimens. The number of CD8+ T lymphocytes in the portal tracts and intralobular areas was scored in equivalent histological fields (original magnification: ×400). To estimate the numbers of Tc 18–27+ cells present in each field, the number of CD8 cells was multiplied by the frequency of Tc 18–27+ cells obtained from CD8 cells purified from the same biopsy.
Figure 5
Figure 5
Ability of Tc 18–27+ CD8 cells to expand after specific peptide stimulation. PBMCs of the indicated patients were stained with Tc 18–27 and anti-CD8 mAbs before or after stimulation with core 18–27 peptide. Stimulated PBMCs were cultured for 10 d and then analyzed by flow cytometry for the presence of Tc 18–27+ cells (as shown in the dot plots). The numbers of Tc 18–27+ out of 5 × 10⁴ cells were calculated directly (white bars) or after 10 d stimulation (hatched bars) by counting Tc 18–27+CD8+ cells out of CD8 cells within the live gate. The difference in expansion potential was significantly different between the two groups (P = 0.004, Fisher's exact test).
Figure 5
Figure 5
Ability of Tc 18–27+ CD8 cells to expand after specific peptide stimulation. PBMCs of the indicated patients were stained with Tc 18–27 and anti-CD8 mAbs before or after stimulation with core 18–27 peptide. Stimulated PBMCs were cultured for 10 d and then analyzed by flow cytometry for the presence of Tc 18–27+ cells (as shown in the dot plots). The numbers of Tc 18–27+ out of 5 × 10⁴ cells were calculated directly (white bars) or after 10 d stimulation (hatched bars) by counting Tc 18–27+CD8+ cells out of CD8 cells within the live gate. The difference in expansion potential was significantly different between the two groups (P = 0.004, Fisher's exact test).
Figure 6
Figure 6
Functional characterization of circulating Tc 18–27+ CD8 cells. (a) Cytolytic activity and IFN-γ production of expanded Tc 18–27+ CD8 cells. Tc 18–27+ CD8 cells obtained after PBMC stimulation with core 18–27 peptide were tested for their ability to lyse HLA-A2+ target cells pulsed or unpulsed with 1 μM of core 18–27 peptide and to produce IFN-γ after stimulation with PMA and ionomycin for 4 h. Experiments with lines derived from patients 10, 7, and 14 are shown. For intracellular IFN-γ production, staining with an IgG isotype control allowed the threshold for IFN-γ–producing cells to be determined. (b) IFN-γ production of circulating Tc 18–27+ CD8 cells. Circulating core 18–27-specific CD8 cells (from patient 10) were tested for their ability to produce IFN-γ after specific peptide stimulation. PBMCs were incubated with or without core 18–27 peptide (1 μm) for 6 h with addition of Brefeldin A (able to block release of intracellular cytokines) after the first 1 h. Cells were stained with Tc 18–27, anti-CD8, and anti–IFN-γ or isotype-matched IgG. The number of Tc 18–27+ CD8 cells producing IFN-γ with or without specific stimulation was calculated gating on resting and activated lymphocytes by forward and side scatter, CD8+ and Tc 18–27+ cells.
Figure 6
Figure 6
Functional characterization of circulating Tc 18–27+ CD8 cells. (a) Cytolytic activity and IFN-γ production of expanded Tc 18–27+ CD8 cells. Tc 18–27+ CD8 cells obtained after PBMC stimulation with core 18–27 peptide were tested for their ability to lyse HLA-A2+ target cells pulsed or unpulsed with 1 μM of core 18–27 peptide and to produce IFN-γ after stimulation with PMA and ionomycin for 4 h. Experiments with lines derived from patients 10, 7, and 14 are shown. For intracellular IFN-γ production, staining with an IgG isotype control allowed the threshold for IFN-γ–producing cells to be determined. (b) IFN-γ production of circulating Tc 18–27+ CD8 cells. Circulating core 18–27-specific CD8 cells (from patient 10) were tested for their ability to produce IFN-γ after specific peptide stimulation. PBMCs were incubated with or without core 18–27 peptide (1 μm) for 6 h with addition of Brefeldin A (able to block release of intracellular cytokines) after the first 1 h. Cells were stained with Tc 18–27, anti-CD8, and anti–IFN-γ or isotype-matched IgG. The number of Tc 18–27+ CD8 cells producing IFN-γ with or without specific stimulation was calculated gating on resting and activated lymphocytes by forward and side scatter, CD8+ and Tc 18–27+ cells.
Figure 7
Figure 7
Phenotypic analysis of Tc 18–27+ CD8 cells. Fresh PBMCs from patients 10 and 7 were analyzed by three-color flow cytometry using the PE-conjugated Tc 18–27, Cychrome–conjugated anti-CD8, and the following FITC-conjugated mAbs: anti–HLA-DR, anti-CD38, anti-CD62L, and anti-CD45RA. Dot plots show data after gating on CD8+ T cells.

Similar articles

Cited by

References

    1. Di Marco V., Lo Iacono O., Camma C., Vaccaro A., Giunta M., Martorana G., Fuschi P., Almasio P.L., Craxi A. The long-term course of chronic hepatitis B. Hepatology. 1999;30:257–264. - PubMed
    1. Chisari F., Ferrari C. Hepatitis B virus immunopathogenesis. Annu. Rev. Immunol. 1995;13:29–60. - PubMed
    1. Moriyama T., Guilhot S., Klopchin K., Moss B., Pinkert C.A., Palmiter R.D., Brinster R.L., Kanagawa O., Chisari F.V. Immunobiology and pathogenesis of hepatocellular injury in hepatitis B virus transgenic mice. Science. 1990;248:361–364. - PubMed
    1. Chisari F.V. Cytotoxic T cells and viral hepatitis. J. Clin. Invest. 1997;99:1472–1477. - PMC - PubMed
    1. Nayersina R., Fowler P., Guilhot S., Missale G., Cerny A., Schlicht H.J., Vitiello A., Chesnut R., Person J.L., Redeker A.J., Chisari F.V. HLA-A2 restricted cytotoxic T lymphocyte responses to multiple hepatitis B surface antigen epitopes during hepatitis B virus infection. J. Immunol. 1993;150:4659–4671. - PubMed

Publication types