. 2000 Apr;12(4):493-506.
doi: 10.1105/tpc.12.4.493.

Structural requirements for ligand binding by a probable plant vacuolar sorting receptor

Affiliations

Structural requirements for ligand binding by a probable plant vacuolar sorting receptor

X Cao et al. Plant Cell. 2000 Apr.

Abstract

How sorting receptors recognize amino acid determinants on polypeptide ligands and respond to pH changes for ligand binding or release is unknown. The plant vacuolar sorting receptor BP-80 binds polypeptide ligands with a central Asn-Pro-Ile-Arg (NPIR) motif. tBP-80, a soluble form of the receptor lacking transmembrane and cytoplasmic sequences, binds the peptide SSSFADSNPIRPVTDRAASTYC as a monomer with a specificity indistinguishable from that of BP-80. tBP-80 contains an N-terminal region homologous to ReMembR-H2 (RMR) protein lumenal domains, a unique central region, and three C-terminal epidermal growth factor (EGF) repeats. By protease digestion of purified secreted tBP-80, and from ligand binding studies with a secreted protein lacking the EGF repeats, we defined three protease-resistant structural domains: an N-terminal/RMR homology domain connected to a central domain, which together determine the NPIR-specific ligand binding site, and a C-terminal EGF repeat domain that alters the conformation of the other two domains to enhance ligand binding. A fragment representing the central domain plus the C-terminal domain could bind ligand but was not specific for NPIR. These results indicate that two tBP-80 binding sites recognize two separate ligand determinants: a non-NPIR site defined by the central domain-EGF repeat domain structure and an NPIR-specific site contributed by the interaction of the N-terminal/RMR homology domain and the central domain.


Figures
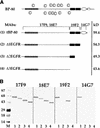
Figure 1
Figure 1
Secretion of Truncated Forms of BP-80 from Drosophila S2 Cells. (A) Structure of truncations. Drawn to scale at the top is a model of BP-80; the open rectangle is the transmembrane domain, the oval represents the EGF-CB repeat (Davis, 1990), the black rectangles represent the EGF repeats, and the checked rectangle represents the domain found in RMR proteins. The circled C symbols identify the positions of Cys residues in the portion of the protein that is N-terminal to the EGF repeats. Shown below, numbered (1) to (4), are the four truncated forms of BP-80 expressed in Drosophila S2 cells. MAbs refers to monoclonal antibodies that recognize BP-80, and brackets above the four truncations indicate the regions of the proteins containing epitopes for the MAbs. At right, kD refers to the predicted molecular masses of the four truncations (minus their signal peptides) as calculated from their amino acid sequences. (B) Binding to different truncated forms of BP-80 by the MAbs. Aliquots of Drosophila S2 cell media from cultures expressing tBP-80 (lanes 1), Δ1EGFR (lanes 2), Δ2EGFR (lanes 3), and Δ3EGFR (lanes 4) were denatured in the absence of disulfide-reducing agents, electrophoresed on a 4 to 20% SDS–polyacrylamide gel, and transferred to nitrocellulose, where replicate blots were incubated with each MAb as indicated. Volumes of culture media used were adjusted to yield roughly equal amounts of each truncated protein; the abundance of Δ1EGFR and Δ2EGFR was ∼0.10 times that of the other two proteins. A secondary antibody coupled to alkaline phosphatase was used to detect the antibody complexes. M indicates prestained blue molecular mass markers, with their size in kilodaltons indicated at left.
Figure 2.
Figure 2.
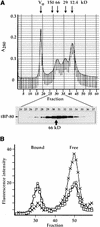
Superdex 200 Chromatography of tBP-80. (A) tBP-80 chromatographs as a monomer. At top is shown a tracing of the A280 profile from calibration of the column by chromatography of four different size standards: a blue dextran peak defines the void volume (Vo), BSA provides a 66-kD peak, carbonic anhydrase provides a 29-kD peak, and cytochrome c provides a 12.4-kD peak. The elution position of 150-kD alcohol dehydrogenase from a separate run is also indicated. The vertical lines beneath the absorbance tracing indicate 0.5-mL fractions, with fraction numbers shown beneath. At bottom is shown protein gel blot detection, by enhanced chemiluminescence, of the elution position of tBP-80 when 0.2 mL of Drosophila S2 medium that had been concentrated fivefold was chromatographed on the column. tBP-80 eluted with a peak in fraction 31; in comparison, the position of elution of 66-kD BSA is indicated by the arrow. (B) Fluorescent ligand binding assay. Medium containing tBP-80 was incubated with 10−7 M BODIPY-FL–labeled proaleurain peptide (*Peptide), as described in Methods, and then chromatographed on the Superdex 200 column. The vertical axis indicates fluorescence intensity for each fraction. Circles indicate *Peptide without competing peptide; X's indicate *Peptide plus a final concentration of 1 mM Spo peptide (sequence SRFNPIRLPT); squares indicate *Peptide plus 1 mM Spo-G peptide (sequence SRFNPgRLPT); Bound indicates the position of *Peptide bound to tBP-80; and Free indicates the elution position of *Peptide not bound to protein.
Figure 3.
Figure 3.
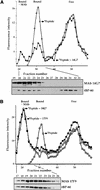
Effects of MAbs on Fluorescent Peptide Binding by tBP-80. (A) Effect of 14G7. At the top, the elution profile of fluorescent peptide incubated with tBP-80 (*Peptide, open circles) is compared with the profile obtained when 10 μg of purified MAb 14G7 was added to the incubation mixture (*Peptide + 14G7, closed circles). Below is shown enhanced chemiluminescence detection on the same protein gel blot of MAb 14G7 (upper panel) and tBP-80 (lower panel). Because samples were not reduced before SDS-PAGE, the antibodies electrophoresed as a large disulfide-linked heavy chain–light chain complex separate from the position of ∼66-kD tBP-80. Bound + MAb indicates the fluorescent peak resulting from *Peptide plus tBP-80 plus antibody; Bound and Free are as given in Figure 2. (B) Effects of 17F9 and 18E7. The elution profile of *Peptide plus tBP-80 (open circles) is compared with profiles obtained when 10 μg of 17F9 (*Peptide + 17F9, closed circles) or of 18E7 (*Peptide + 18E7, open squares) was added to the incubation mixtures. Below is shown protein gel blot detection of 17F9, and tBP-80 in the indicated fractions from the *Peptide + 17F9 chromatography run.
Figure 4.
Figure 4.
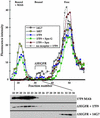
Binding Assays for Δ3EGFR. (Top) Medium containing Δ3EGFR protein was incubated with fluorescent proaleurain peptide plus 14G7 MAb (open circles), the peptide plus 18E7 MAb (yellow squares), the peptide plus 17F9 MAb (blue circles), the peptide plus 17F9 MAb plus 1 mM Spo-G peptide (green squares), or proaleurain peptide plus 17F9 MAb plus 1 mM Spo peptide (red triangles), and then chromatographed as in Figure 3. Because 14G7 MAb does not interact with Δ3EGFR, the open circle elution profile shows the ability of Δ3EGFR not complexed with antibodies to bind only a very small amount of labeled peptide (peak indicated by the bracket). (+) shows the elution profile of labeled peptide incubated with 17F9 MAb in the absence of culture medium. (Bottom) Protein gel blot detection of 17F9 MAb (top) and of Δ3EGFR (middle) from the chromatography fractions indicated by the closed circles and of Δ3EGFR (bottom) from the chromatography run shown by the open circles. Bound and Free are as given in Figure 2.
Figure 5.
Figure 5.
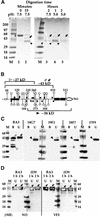
Mapping of Structural Domains in tBP-80. (A) Digestion of tBP-80 with endoproteinase Asp-N. Ten-microgram samples of purified tBP-80 were incubated with endoproteinase Asp-N in a total reaction volume of 50 μL for the times and at the pH values indicated at the top of the figure. For lanes 1, 2, and 4, the incubation temperature was 22°C. For lanes 3 and 5, the samples were incubated for 1 hr at 22°C and then for a second hour at 37°C. Protease activity was stopped by the addition of EDTA, and the samples were denatured (in the absence of β-mercaptoethanol [βME] for lanes 1 and 2 or with βME for lanes 3 to 5), electrophoresed on 4 to 20% SDS–polyacrylamide gels, and stained with Coomassie Brilliant Blue R 250. M, prestained molecular mass markers with sizes in kilodaltons indicated at left; *, intact tBP-80; arrows, ∼43-kD fragments; arrowheads, ∼38-kD fragments. (B) tBP-80 drawn to scale: open rectangle, sequence recognized by RA3 antibodies; solid circles, Cys residues; open circles, Asp residues (those inside EGF repeats not shown); triangle, potential Asn-glycosylation site; small numbers, positions of residues indicated by open circles with longer stems; large numbers, approximate fragment sizes for fragments indicated by designated symbols in (C); other symbols are as given in Figure 1. (Note that Figure 1 of Paris et al. [1997] contains a typographical error; the residue at position 37 of NP471 [BP-80] is Glu, not Asp.) (C) Antibody mapping of protease-resistant fragments. Twelve micrograms of tBP-80 in 50 μL of 0.01 M Tris-HCl, pH 7.5, was digested with 0.012 μg of Asp-N for 1 hr at 22°C plus 1 hr at 37°C. The reactions were stopped with EDTA; the solutions were brought to final concentrations of 1% SDS and 0.1 M Tris-HCl, pH 7.5, and heated at 65°C for 10 min; then 200 μL of Tris-buffered saline containing 1.25% Nonidet P-40 was added, followed by 5 μg of affinity-purified RA3 antibodies, and the mixture was incubated at 4°C overnight. Antibodies were removed in two sequential treatments with protein A–Sepharose, and the beads were washed four times with the solution of Tris-buffered saline and Nonidet P-40. Proteins in the antibody bound and unbound fractions were then prepared for SDS-PAGE by heating at 100°C for 10 min in the absence of disulfide-reducing agents. Equal aliquots of bound (B) or unbound (U) fractions were loaded on 4 to 20% gradient gels in pairs separated by a lane of molecular mass markers (M) prestained blue (masses are given in kilodaltons at left). (D) Effects of βME on ∼43-kD N-terminal protease-resistant fragments. Equal aliquots of RA3 unbound (U) fractions from 1- and 2-hr (h) incubations were used. For the gels at left, samples were not treated with βME before electrophoresis (indicated by NO at bottom); for the gels on the right, samples were reduced in the presence of βME before electrophoresis (indicated by YES at bottom). The N-terminal protease-resistant fragments were detected either with polyclonal RA3 antibodies or with MAb 2D9, as indicated above each set of gels. Solid arrows indicate the broad ∼43-kD bands detected by the antibodies. For both (C) and (D), after transfer to nitrocellulose, blots were cut down the middle of the marker lanes to separate them for treatment with the different antibodies, as indicated above each set of gels, and antibody complexes were detected with chemiluminescence. The positions of the labeled bands on x-ray film could be precisely aligned with the blots because the peroxidase reaction generated a yellow-brown color on the membrane on the most heavily labeled bands. The hollow appearance of labeled bands in (D) is an artifact of the presence of very large amounts of antigen on the blots at those positions. Symbols are as given in (A); other symbols are described in the text.
Figure 6.
Figure 6.
Affinity Column Assay for Ligand Binding by Protease-Resistant Fragments. Fifteen micrograms of tBP-80 was digested in 50 μL of 10 mM Tris-HCl, pH 7.5, with endoproteinase Asp-N at 22°C for 1 hr. Protease activity was stopped with EDTA, and the mixture was diluted to 1 mL with column buffer containing 100 μg/mL gelatin. To each of three 250-μL aliquots was added 50 μL of proaleurain peptide–agarose (3 mg of peptide per mL of gel; Kirsch et al., 1994). For the aliquot providing the samples analyzed in lanes 1 and 2, no competing peptide was added; for the aliquot analyzed in lanes 3 and 4, 0.5 mM Spo peptide was added; and for the aliquot analyzed in lanes 5 and 6, 0.5 mM proaleurain peptide was added. The mixtures were incubated on a rotating shaker at 4°C overnight, after which the agarose for each was collected by centrifugation and the supernates containing unbound proteins (U) were saved. After washing three times with column buffer at 4°C, bound proteins (B) were eluted from the agarose by heating it in 150 μL of SDS-PAGE sample buffer at 100°C for 10 min. Samples representing 10% of the volume of each fraction were denatured in the absence of βME and electrophoresed as in Figure 5. After transfer to nitrocellulose, protease-resistant fragments were detected with MAb 14G7 to allow mapping from the C terminus of tBP-80. Open arrow, position of fragments consistent with full-length tBP-80; solid arrow, position of ∼43-kD fragments; open arrowhead, position of ∼38-kD fragments. M, prestained molecular mass markers with sizes in kilodaltons indicated at left.
Figure 7.
Figure 7.
Structural Model. The N-terminal/RMR homology domain is indicated in red, the central domain in yellow, the EFG repeat domain in blue, and the NPIR-specific ligand binding site in white; the shapes of the objects are solely for the purposes of illustration and probably have no relationship to reality. Scissors indicate regions digested by endoproteinase Asp-N to give products by way of reactions 1 and 2, and the protease-accessible sequences are depicted by black loops. In reaction 3, a MAb (green) interacts with the central domain of Δ3EGFR.

Similar articles

Cited by

References

    1. Boller, T., and Kende, H. (1979). Hydrolytic enzymes in the central vacuole of plant cells. Plant Physiol. 63, 1123–1132. - PMC - PubMed
    1. Bowen, B.R., Fennie, C., and Lasky, L.A. (1990). The Mel 14 antibody binds to the lectin domain of the murine peripheral lymph node homing receptor. J. Cell Biol. 110, 147–153. - PMC - PubMed
    1. Cereghino, J.L., Marcusson, E.G., and Emr, S.D. (1995). The cytoplasmic tail domain of the vacuolar protein sorting receptor Vps10p and a subset of VPS gene products regulate receptor stability, function, and localization. Mol. Biol. Cell 6, 1089–1102. - PMC - PubMed
    1. Cooper, A.A., and Stevens, T.H. (1996). Vps10p cycles between the late-Golgi and prevacuolar compartments in its function as the sorting receptor for multiple yeast vacuolar hydrolases. J. Cell Biol. 133, 529–541. - PMC - PubMed
    1. Davis, C.G. (1990). The many faces of epidermal growth factor repeats. New Biol. 2, 410–419. - PubMed

Publication types

MeSH terms

LinkOut - more resources