Rearrangements of human mitochondrial DNA (mtDNA): new insights into the regulation of mtDNA copy number and gene expression
- PMID: 10749943
- PMCID: PMC14860
- DOI: 10.1091/mbc.11.4.1471
Rearrangements of human mitochondrial DNA (mtDNA): new insights into the regulation of mtDNA copy number and gene expression
Abstract
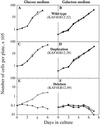
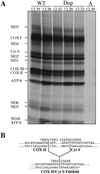
Mitochondria from patients with Kearns-Sayre syndrome harboring large-scale rearrangements of human mitochondrial DNA (mtDNA; both partial deletions and a partial duplication) were introduced into human cells lacking endogenous mtDNA. Cytoplasmic hybrids containing 100% wild-type mtDNA, 100% mtDNA with partial duplications, and 100% mtDNA with partial deletions were isolated and characterized. The cell lines with 100% deleted mtDNAs exhibited a complete impairment of respiratory chain function and oxidative phosphorylation. In contrast, there were no detectable respiratory chain or protein synthesis defects in the cell lines with 100% duplicated mtDNAs. Unexpectedly, the mass of mtDNA was identical in all cell lines, despite the fact that different lines contained mtDNAs of vastly different sizes and with different numbers of replication origins, suggesting that mtDNA copy number may be regulated by tightly controlled mitochondrial dNTP pools. In addition, quantitation of mtDNA-encoded RNAs and polypeptides in these lines provided evidence that mtDNA gene copy number affects gene expression, which, in turn, is regulated at both the post-transcriptional and translational levels.
Figures


Similar articles
-
Maintenance of human rearranged mitochondrial DNAs in long-term cultured transmitochondrial cell lines.Mol Biol Cell. 2000 Jul;11(7):2349-58. doi: 10.1091/mbc.11.7.2349. Mol Biol Cell. 2000. PMID: 10888673 Free PMC article.
-
Structural and functional mitochondrial abnormalities associated with high levels of partially deleted mitochondrial DNAs in somatic cell hybrids.Somat Cell Mol Genet. 1992 Sep;18(5):431-42. doi: 10.1007/BF01233083. Somat Cell Mol Genet. 1992. PMID: 1362009
-
Are duplications of mitochondrial DNA characteristic of Kearns-Sayre syndrome?Hum Mol Genet. 1994 Jun;3(6):947-51. doi: 10.1093/hmg/3.6.947. Hum Mol Genet. 1994. PMID: 7951243 Clinical Trial.
-
Mitochondrial encephalomyopathy and hypoparathyroidism associated with a duplication and a deletion of mitochondrial deoxyribonucleic acid.J Clin Endocrinol Metab. 1998 Jan;83(1):125-9. doi: 10.1210/jcem.83.1.4497. J Clin Endocrinol Metab. 1998. PMID: 9435428 Review.
-
[Deletions of mitochondrial DNA in Kearns-Sayre syndrome].Nihon Rinsho. 1993 Sep;51(9):2386-90. Nihon Rinsho. 1993. PMID: 8411717 Review. Japanese.
Cited by
-
Engineering Genetic Systems for Treating Mitochondrial Diseases.Pharmaceutics. 2021 May 28;13(6):810. doi: 10.3390/pharmaceutics13060810. Pharmaceutics. 2021. PMID: 34071708 Free PMC article. Review.
-
Expression changes in DNA repair enzymes and mitochondrial DNA damage in aging rat lens.Mol Vis. 2010 Aug 27;16:1754-63. Mol Vis. 2010. PMID: 20808729 Free PMC article.
-
Maintenance of human rearranged mitochondrial DNAs in long-term cultured transmitochondrial cell lines.Mol Biol Cell. 2000 Jul;11(7):2349-58. doi: 10.1091/mbc.11.7.2349. Mol Biol Cell. 2000. PMID: 10888673 Free PMC article.
-
Human mitochondrial DNA with large deletions repopulates organelles faster than full-length genomes under relaxed copy number control.Nucleic Acids Res. 2002 Nov 1;30(21):4626-33. doi: 10.1093/nar/gkf602. Nucleic Acids Res. 2002. PMID: 12409452 Free PMC article.
-
Absence of a universal mechanism of mitochondrial toxicity by nucleoside analogs.Antimicrob Agents Chemother. 2007 Jul;51(7):2531-9. doi: 10.1128/AAC.00039-07. Epub 2007 Apr 30. Antimicrob Agents Chemother. 2007. PMID: 17470651 Free PMC article.
References
-
- Anderson S, et al. Sequence and organization of the human mitochondrial genome. Nature. 1981;290:457–465. - PubMed
-
- Ballinger SW, Shoffner JM, Gebhart S, Koontz DA, Wallace DC. Mitochondrial diabetes revisited (letter) Nat Genet. 1994;7:458–459. - PubMed
-
- Ballinger SW, Shoffner JM, Hedaya EV, Trounce I, Polak MA, Koontz DA, Wallace DC. Maternally transmitted diabetes and deafness associated with a 10.4 kb mitochondrial DNA deletion. Nat Genet. 1992;1:11–15. - PubMed
-
- Berenberg RA, et al. Lumping or splitting? “ophthalmoplegia plus” or Kearns-Sayre syndrome? Ann Neurol. 1977;1:37–43. - PubMed
-
- Bestwick RK, Moffett GL, Mathews CK. Selective expansion of mitochondrial nucleoside triphosphate pools in antimetabolite-treated HeLa cells. J Biol Chem. 1982;257:9300–9304. - PubMed
Publication types
MeSH terms
Substances
Grants and funding
LinkOut - more resources
Full Text Sources

