Comparative Study
. 2000 Apr 3;19(7):1494-504.
doi: 10.1093/emboj/19.7.1494.

GATE-16, a membrane transport modulator, interacts with NSF and the Golgi v-SNARE GOS-28

Affiliations
Comparative Study

GATE-16, a membrane transport modulator, interacts with NSF and the Golgi v-SNARE GOS-28

Y Sagiv et al. EMBO J. .

Abstract

Membrane proteins located on vesicles (v-SNAREs) and on the target membrane (t-SNAREs) mediate specific recognition and, possibly, fusion between a transport vesicle and its target membrane. The activity of SNARE molecules is regulated by several soluble cytosolic proteins. We have cloned a bovine brain cDNA encoding a conserved 117 amino acid polypeptide, denoted Golgi-associated ATPase Enhancer of 16 kDa (GATE-16), that functions as a soluble transport factor. GATE-16 interacts with N-ethylmaleimidesensitive factor (NSF) and significantly stimulates its ATPase activity. It also interacts with the Golgi v-SNARE GOS-28 in an NSF-dependent manner. We propose that GATE-16 modulates intra-Golgi transport through coupling between NSF activity and SNAREs activation.


Figures

None
Fig. 1. Sequence of bovine GATE–16. (A) Sequence of the cloned GATE–16 cDNA from bovine brain and the deduced amino acid sequence. Boxed amino acids correspond to sequences obtained from tryptic fragments of the purified protein. Underlined nucleotides at the 5′–untranslated region represent the ‘Kozak’ sequence for initiation of translation; underlined nucleotides at the 3′–untranslated region represent the signal for poly– adenylation. (B) GATE–16 aligned with its homologs using the ClustalW multiple sequence alignment program version 1.7. Sequence alignment is depicted by the SeqVu 1.0.1 program, identity is represented by a black frame and homology by a gray background. Mammalian GATE–16 from bovine (accession No. AF20262), rat (AB 003515), mouse (AA124324) and human (AJ010569) (full-length EST sequences found at the NCBI) are 100% identical in their amino acid sequences. (C) To determine the expression pattern of GATE–16, homogenates were prepared from different organs of a freshly sacrificed rat, and 42 μg of each sample were separated by 14% SDS–PAGE. GATE–16 was visualized by Western blotting using affinity-purified anti-GATE–16 antibodies. No differences were observed in the total protein between the different samples, as determined by amido black staining of the nitrocellulose filters.
None
Fig. 2. Recombinant GATE–16 is active in a cell-free intra-Golgi transport assay. GATE–16 cDNA was cloned into a pRSET–C vector and expressed in E.coli to create a His6-tagged recombinant protein as described in Materials and methods. (A) Proteins eluted from an Ni2+-NTA column (lane 1), unbound material (lane 2) and purified His6GATE–16 eluted from a Mono–S column (lane 3). Proteins were run on a 14% SDS–polyacrylamide gel and visualized by Coomassie blue staining. (B) Increasing amounts of GATE–16 purified from bovine brains (○) or His6GATE–16 (•) were added to the GATE–16-dependent cell-free transport assay (see Materials and methods). (C) His6GATE–16 (25 ng) was added to the GATE–16-dependent transport assay in the presence or absence of 30 ng of αSNAP. Assays were carried out in duplicate, and the mean is plotted with the error bar representing the higher value. (D) Salt-washed Golgi membranes (1 M KCl) were used in the GATE–16-dependent transport assay in the absence or presence of 25 ng of His6-GATE–16.
None
Fig. 3. Anti-GATE–16 antibodies inhibit intra-Golgi transport in vitro. (A) Increasing amounts of anti-GATE–16 antibodies (•) or IgGs from pre-immune serum (○) were added to the cell-free transport assay in the presence of 50 μg of crude bovine brain cytosol. (B) Anti-GATE–16 antibodies (150 ng) and 2.5 μg of His6GATE–16 were added to the standard transport reaction as indicated. (C) A standard intra-Golgi transport assay was carried out at 30°C for 2 h. At the indicated time points (marked by the symbols), anti-GATE–16 antibodies (150 ng, ○), Rab-GDI (1 μg, ▪) or GTPγS (50 μM, □) were added and the reaction was terminated after 2 h. The progression of transport in the absence of inhibitors was measured by transferring samples to ice at the indicated time points (•).
None
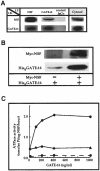
Fig. 4. GATE–16 interacts specifically with NSF. (A) Bovine brain cytosol (1.2 mg) was immunoprecipitated (IP) with anti-GATE–16 and anti-NSF antibodies, or with pre-immune IgGs as control. Immunoprecipitates were washed (see Materials and methods), and proteins were eluted with 2% SDS at 95°C for 2 min and analyzed by Western blots (IB) using the indicated antibodies. The right panel (cytosol) represents 150 ng of total cytosolic proteins. (B) His6GATE–16 (200 ng) was mixed with agarose beads coupled to anti-Myc epitope monoclonal antibodies (20 μl) in the presence or absence of Myc-tagged NSF (300 ng) for 120 min at 4°C. The immunoprecipitates were immunoblotted and reacted with anti-GATE–16 and anti-NSF antibodies. (C) ATPase activity of NSF was measured in 50 μl of reaction buffer (10 mM PIPES–KOH pH 6.8, 200 mM sucrose, 150 mM MnCl2, 1 mM ATP and 2 mM DTT) in the presence of 1.5 μg/ml His6NSF and the indicated concentration of His6GATE–16 (•), or in the presence of heat-inactivated His6GATE–16 (65°C, 30 min) (▴). Samples were incubated for 2 h at 30°C and ATPase activity was determined as described (Lill et al., 1990). The dashed line indicates ATPase activity measured in the absence of NSF. The background signal from reactions incubated with NSF and ATP on ice was subtracted.
None
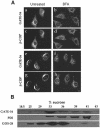
Fig. 5. GATE–16 is localized on the Golgi. (A) NRK (a–d) and NIH 3T3 cells (e–h) were incubated in the absence (a, c, e and g) or presence (b, d, f and h) of 15 μM BFA for 1 h before fixation. Cells were incubated with both anti-GATE–16 antibodies and mouse monoclonal anti-β–COP antibodies. Rhodamine-conjugated goat anti-rabbit IgGs were used to detect GATE–16 (a, b, e and f); FITC-conjugated goat anti-mouse IgGs were used to detect β–COP (c, d, g and h). Bar = 10 μm. (B) Bovine brain post-nuclear supernatant in 0.5 M sucrose was overlaid on top of a sucrose step gradient composed of 0.86 and 1.25 M sucrose layers. Following centrifugation, the 0.86/1.25 sucrose interface was adjusted to 1.6 M sucrose and loaded at the bottom of a second step gradient of 1.25, 1.0, 0.86 and 0.5 M sucrose. The gradients were centrifuged, and the indicated fractions were analyzed by immunoblotting with either anti-GATE–16 antibodies, anti-GOS–28 (a Golgi marker) or anti-PDI (an ER marker) antibodies.
None
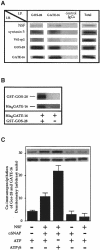
Fig. 6. GATE–16 interacts with GOS–28. (A) Detergent extracts (40 μg) of rat liver Golgi membranes and His6-GATE–16 (1 μg) were immunoprecipitated with either anti-GATE–16, anti-GOS–28 antibodies, or pre-immune IgGs as control. Immunoprecipitates were analyzed by Western blots using the indicated antibodies. Total (right panel) represents 10% of the membrane detergent extract used for each experiment in the presence of His6-GATE–16. (B) Glutathione–agarose beads were incubated with His6GATE–16 in the presence of recombinant GST–GOS–28 (left) or GST alone (right). The glutathione–agarose beads were washed and the bound material was eluted with free glutathione and analyzed by Western blots. (C) Detergent extracts were immunoprecipitated with anti-GATE–16 antibodies in the presence of 5 mM MgCl2 and with either NSF (0.3 μg), αSNAP (0.8 μg), 1 mM ATP or 1 mM ATPγS, as indicated. The immunoprecipitates were analyzed by Western blots to detect co-immunoprecipitated GOS–28. Panels show immunoblots of GOS-28 (top) and GATE-16 (bottom) of the respective samples.
None
Fig. 7. GATE–16 protects the membrane-bound GOS–28 from proteolysis. (A) Golgi membranes (12.5 μg) were incubated in a final volume of 100 μl under standard transport conditions (see Materials and methods) with the indicated amounts of anti-GATE–16 antibodies and recombinant GATE–16 for 15 min at 37°C. Membranes were then mounted on top of a 15% sucrose cushion and pelleted by ultracentrifugation. The membrane pellets and the supernatant trichloroacetic acid precipitates were subjected to Western blot analysis. To detect the 10 kDa fragment corresponding to the GOS–28 degradation product, the image was sharpened using the Adobe Photoshop program. (B) Golgi membranes were incubated at the indicated temperature with 1 μg of anti-GATE–16 antibodies or with 1 μg of pre-immune IgGs, in the presence or absence of a protease inhibitor cocktail (PIC), and analyzed by Western blots as described above. The PIC consisted of leupeptin (0.5 μg/ml), pepstatin A (1.4 μg/ml), aprotinin (2 μg/ml) and PMSF (1 mM).

Similar articles

Cited by

References

    1. Balch W.E., Dunphy, W.G., Braell, W.A. and Rothman, J.E. (1984) Reconstitution of the transport of protein between successive compartments of the Golgi measured by the coupled incorporation of N-acetylglucosamine. Cell, 39, 405–416. - PubMed
    1. Barlowe C. (1997) Coupled ER to Golgi transport reconstituted with purified cytosolic proteins. J. Cell Biol., 139, 1097–1108. - PMC - PubMed
    1. Block M.R., Glick, B.S., Wilcox, C.A., Wieland, F.T. and Rothman, J.E. (1988) Purification of an N-ethylmaleimide-sensitive protein catalyzing vesicular transport. Proc. Natl Acad. Sci. USA, 85, 7852–7856. - PMC - PubMed
    1. Cao X., Ballew, N. and Barlowe, C. (1998) Initial docking of ER-derived vesicles requires Uso1p and Ypt1p but is independent of SNARE proteins. EMBO J., 17, 2156–2165. - PMC - PubMed
    1. Clary D.O., Griff, I.C. and Rothman, J.E. (1990) SNAPs, a family of NSF attachment proteins involved in intracellular membrane fusion in animals and yeast. Cell, 61, 709–721. - PubMed

Publication types

MeSH terms

Associated data