Whole-genome expression analysis of snf/swi mutants of Saccharomyces cerevisiae
- PMID: 10725359
- PMCID: PMC16245
- DOI: 10.1073/pnas.97.7.3364
Whole-genome expression analysis of snf/swi mutants of Saccharomyces cerevisiae
Abstract
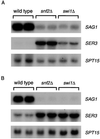
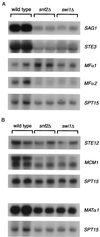
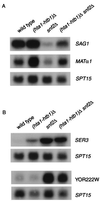
The Saccharomyces cerevisiae Snf/Swi complex has been previously demonstrated to control transcription and chromatin structure of particular genes in vivo and to remodel nucleosomes in vitro. We have performed whole-genome expression analysis, using DNA microarrays, to study mutants deleted for a gene encoding one conserved (Snf2) or one unconserved (Swi1) Snf/Swi component. This analysis was performed on cells grown in both rich and minimal media. The microarray results, combined with Northern blot, computational, and genetic analyses, show that snf2Delta and swi1Delta mutations cause similar effects on mRNA levels, that Snf/Swi controls some genes differently in rich and minimal media, and that Snf/Swi control is exerted at the level of individual genes rather than over larger chromosomal domains. In addition, this work shows that Snf/Swi controls mRNA levels of MATalpha-specific genes, likely via controlling transcription of the regulators MATalpha1 and MCM1. Finally, we provide evidence that Snf/Swi acts both as an activator and as a repressor of transcription, and that neither mode of control is an indirect effect of the other.
Figures


Similar articles
-
The nucleosome remodeling complex, Snf/Swi, is required for the maintenance of transcription in vivo and is partially redundant with the histone acetyltransferase, Gcn5.EMBO J. 1999 Jun 1;18(11):3101-6. doi: 10.1093/emboj/18.11.3101. EMBO J. 1999. PMID: 10357821 Free PMC article.
-
A new class of histone H2A mutations in Saccharomyces cerevisiae causes specific transcriptional defects in vivo.Mol Cell Biol. 1995 Apr;15(4):1999-2009. doi: 10.1128/MCB.15.4.1999. Mol Cell Biol. 1995. PMID: 7891695 Free PMC article.
-
Evidence that Swi/Snf directly represses transcription in S. cerevisiae.Genes Dev. 2002 Sep 1;16(17):2231-6. doi: 10.1101/gad.1009902. Genes Dev. 2002. PMID: 12208846 Free PMC article.
-
Yeast SNF/SWI transcriptional activators and the SPT/SIN chromatin connection.Trends Genet. 1992 Nov;8(11):387-91. doi: 10.1016/0168-9525(92)90300-s. Trends Genet. 1992. PMID: 1332230 Review.
-
The SNF/SWI family of global transcriptional activators.Curr Opin Cell Biol. 1994 Jun;6(3):396-402. doi: 10.1016/0955-0674(94)90032-9. Curr Opin Cell Biol. 1994. PMID: 7917331 Review.
Cited by
-
Discovery of biological networks from diverse functional genomic data.Genome Biol. 2005;6(13):R114. doi: 10.1186/gb-2005-6-13-r114. Epub 2005 Dec 19. Genome Biol. 2005. PMID: 16420673 Free PMC article.
-
Haploinsufficiency of Snf5 (integrase interactor 1) predisposes to malignant rhabdoid tumors in mice.Proc Natl Acad Sci U S A. 2000 Dec 5;97(25):13796-800. doi: 10.1073/pnas.250492697. Proc Natl Acad Sci U S A. 2000. PMID: 11095756 Free PMC article.
-
Histone H2A.Z regulates the expression of several classes of phosphate starvation response genes but not as a transcriptional activator.Plant Physiol. 2010 Jan;152(1):217-25. doi: 10.1104/pp.109.145532. Epub 2009 Nov 6. Plant Physiol. 2010. PMID: 19897606 Free PMC article.
-
Interferon-gamma-induced chromatin remodeling at the CIITA locus is BRG1 dependent.EMBO J. 2002 Apr 15;21(8):1978-86. doi: 10.1093/emboj/21.8.1978. EMBO J. 2002. PMID: 11953317 Free PMC article.
-
The SWI/SNF chromatin-remodeling complex subunit SNF5 is essential for hepatocyte differentiation.EMBO J. 2005 Sep 21;24(18):3313-24. doi: 10.1038/sj.emboj.7600802. Epub 2005 Sep 1. EMBO J. 2005. PMID: 16138077 Free PMC article.
References
-
- Workman J L, Kingston R E. Annu Rev Biochem. 1998;67:545–579. - PubMed
-
- Kingston R E, Narlikar G J. Genes Dev. 1999;13:2339–2352. - PubMed
-
- Cairns B R. Trends Biochem Sci. 1998;23:20–25. - PubMed
-
- Kornberg R D, Lorch Y. Curr Opin Genet Dev. 1999;9:148–151. - PubMed
-
- Kingston R E, Bunker C A, Imbalzano A N. Genes Dev. 1996;10:905–920. - PubMed
Publication types
MeSH terms
Substances
Grants and funding
LinkOut - more resources
Full Text Sources
Other Literature Sources
Molecular Biology Databases

