Peripheral odor coding in the rat and frog: quality and intensity specification
- PMID: 10704512
- PMCID: PMC6772510
- DOI: 10.1523/JNEUROSCI.20-06-02383.2000
Peripheral odor coding in the rat and frog: quality and intensity specification
Abstract
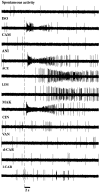
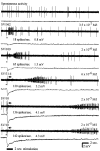
In mammals, two recent studies have shown recently that one odor molecule can be recognized by several molecular olfactory receptors (ORs), and a single OR can recognize multiple odor molecules. In addition, one olfactory receptor neuron (ORN) may respond to different stimuli chosen as representative of distinct odor qualities. The aim of the present study was to analyze quality and intensity coding abilities of rat single ORNs, comparing them with previous extensive data gathered in the frog to get insight into the generality of olfactory coding mechanisms over vertebrates. Response properties of 90 rat ORNs to different odors or to one odor at different concentrations were analyzed. In the rat and the frog, odor quality appears to be specified through the identity of activated ORNs. However, rat ORNs have higher response thresholds. This lower sensitivity may be interpreted as an increase in selectivity of rat ORNs for low or medium odor intensities. In these conditions, the lower proportion of activated ORNs could be counterbalanced by their number, as well as by their higher glomerular convergence ratio in the olfactory bulb. From amphibians to mammals, the olfactory system appears to use universal mechanisms based on a combinatorial-coding mode that may allow quasi-infinite possibilities of adaptation to various olfactory environments.
Figures


Similar articles
-
Intensity invariant dynamics and odor-specific latencies in olfactory receptor neuron response.J Neurosci. 2013 Apr 10;33(15):6285-97. doi: 10.1523/JNEUROSCI.0426-12.2013. J Neurosci. 2013. PMID: 23575828 Free PMC article.
-
Temporal structure of receptor neuron input to the olfactory bulb imaged in behaving rats.J Neurophysiol. 2009 Feb;101(2):1073-88. doi: 10.1152/jn.90902.2008. Epub 2008 Dec 17. J Neurophysiol. 2009. PMID: 19091924 Free PMC article.
-
Temporal coding of odor mixtures in an olfactory receptor neuron.Proc Natl Acad Sci U S A. 2011 Mar 22;108(12):5075-80. doi: 10.1073/pnas.1100369108. Epub 2011 Mar 7. Proc Natl Acad Sci U S A. 2011. PMID: 21383179 Free PMC article.
-
The olfactory bulb: coding and processing of odor molecule information.Science. 1999 Oct 22;286(5440):711-5. doi: 10.1126/science.286.5440.711. Science. 1999. PMID: 10531048 Review.
-
Odor discrimination by G protein-coupled olfactory receptors.Microsc Res Tech. 2002 Aug 1;58(3):135-41. doi: 10.1002/jemt.10131. Microsc Res Tech. 2002. PMID: 12203691 Review.
Cited by
-
Coding of odors by temporal binding within a model network of the locust antennal lobe.Front Comput Neurosci. 2013 Apr 25;7:50. doi: 10.3389/fncom.2013.00050. eCollection 2013. Front Comput Neurosci. 2013. PMID: 23630495 Free PMC article.
-
Molecular tuning of odorant receptors and its implication for odor signal processing.Chem Senses. 2009 Sep;34(7):535-45. doi: 10.1093/chemse/bjp028. Epub 2009 Jun 12. Chem Senses. 2009. PMID: 19525317 Free PMC article. Review.
-
A model for non-monotonic intensity coding.R Soc Open Sci. 2015 May 6;2(5):150120. doi: 10.1098/rsos.150120. eCollection 2015 May. R Soc Open Sci. 2015. PMID: 26064666 Free PMC article.
-
CNS*2007. Abstracts of the 16th Annual Computational Neuroscience Meeting, Toronto, Canada, 7-12 July 2007.BMC Neurosci. 2007;8 Suppl 2:S1-P207. Epub 2007 Jul 6. BMC Neurosci. 2007. PMID: 17634105 No abstract available.
-
In vivo whole-cell recording of odor-evoked synaptic transmission in the rat olfactory bulb.J Neurosci. 2003 May 15;23(10):4108-16. doi: 10.1523/JNEUROSCI.23-10-04108.2003. J Neurosci. 2003. PMID: 12764098 Free PMC article.
References
-
- Breer H, Boekhoff I, Tareilus E. Rapid kinetics of second messenger formation in olfactory transduction. Nature. 1990;345:65–68. - PubMed
-
- Bronstein AA. Olfactory receptors of vertebrates (in Russian) (Setchenova IM, ed), pp 1–159. Sciences Editions; Leningrad: 1977.
-
- Buck L. Identification and analysis of a multigene family encoding odorant receptors: implications for mechanisms underlying olfactory information processing. Chem Senses. 1993;18:203–208.
-
- Buck L, Axel R. A novel multigene family may encode odorant receptors: a molecular basis for odor recognition. Cell. 1991;65:175–187. - PubMed
-
- Byrd CA, Burd GD. Development of the olfactory bulb in the clawed frog, Xenopus laevis: a morphological and quantitative analysis. J Comp Neurol. 1991;314:79–90. - PubMed
Publication types
MeSH terms
Substances
LinkOut - more resources
Full Text Sources
