Rapid nanopore discrimination between single polynucleotide molecules
- PMID: 10655487
- PMCID: PMC15527
- DOI: 10.1073/pnas.97.3.1079
Rapid nanopore discrimination between single polynucleotide molecules
Abstract
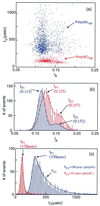
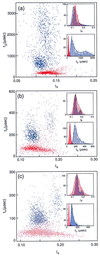
A variety of different DNA polymers were electrophoretically driven through the nanopore of an alpha-hemolysin channel in a lipid bilayer. Single-channel recording of the translocation duration and current flow during traversal of individual polynucleotides yielded a unique pattern of events for each of the several polymers tested. Statistical data derived from this pattern of events demonstrate that in several cases a nanopore can distinguish between polynucleotides of similar length and composition that differ only in sequence. Studies of temperature effects on the translocation process show that translocation duration scales as approximately T(-2). A strong correlation exists between the temperature dependence of the event characteristics and the tendency of some polymers to form secondary structure. Because nanopores can rapidly discriminate and characterize unlabeled DNA molecules at low copy number, refinements of the experimental approach demonstrated here could eventually provide a low-cost high-throughput method of analyzing DNA polynucleotides.
Figures


Similar articles
-
Voltage-driven DNA translocations through a nanopore.Phys Rev Lett. 2001 Apr 9;86(15):3435-8. doi: 10.1103/PhysRevLett.86.3435. Phys Rev Lett. 2001. PMID: 11327989
-
Measurements of DNA immobilized in the alpha-hemolysin nanopore.Methods Mol Biol. 2012;870:39-53. doi: 10.1007/978-1-61779-773-6_3. Methods Mol Biol. 2012. PMID: 22528257
-
Multichannel simultaneous measurements of single-molecule translocation in alpha-hemolysin nanopore array.Anal Chem. 2009 Dec 15;81(24):9866-70. doi: 10.1021/ac901732z. Anal Chem. 2009. PMID: 20000639
-
Nanopores and nucleic acids: prospects for ultrarapid sequencing.Trends Biotechnol. 2000 Apr;18(4):147-51. doi: 10.1016/s0167-7799(00)01426-8. Trends Biotechnol. 2000. PMID: 10740260 Review.
-
Characterization of nucleic acids by nanopore analysis.Acc Chem Res. 2002 Oct;35(10):817-25. doi: 10.1021/ar000138m. Acc Chem Res. 2002. PMID: 12379134 Review.
Cited by
-
Ion transport and ultra-efficient osmotic power generation in boron nitride nanotube porins.Sci Adv. 2024 Sep 6;10(36):eado8081. doi: 10.1126/sciadv.ado8081. Epub 2024 Sep 6. Sci Adv. 2024. PMID: 39241077 Free PMC article.
-
PEG-labeled nucleotides and nanopore detection for single molecule DNA sequencing by synthesis.Sci Rep. 2012;2:684. doi: 10.1038/srep00684. Epub 2012 Sep 21. Sci Rep. 2012. PMID: 23002425 Free PMC article.
-
Stochastic sensing on a modular chip containing a single-ion channel.Anal Chem. 2007 Mar 15;79(6):2207-13. doi: 10.1021/ac0614285. Epub 2007 Feb 9. Anal Chem. 2007. PMID: 17288404 Free PMC article.
-
Imaging alpha-hemolysin with molecular dynamics: ionic conductance, osmotic permeability, and the electrostatic potential map.Biophys J. 2005 Jun;88(6):3745-61. doi: 10.1529/biophysj.104.058727. Epub 2005 Mar 11. Biophys J. 2005. PMID: 15764651 Free PMC article.
-
Whole cell patch clamp recording performed on a planar glass chip.Biophys J. 2002 Jun;82(6):3056-62. doi: 10.1016/S0006-3495(02)75646-4. Biophys J. 2002. PMID: 12023228 Free PMC article.
References
-
- Song L, Hobaugh M R, Shustak C, Cheley S, Bayley H, Gouax J E. Science. 1996;274:1859–1865. - PubMed
-
- Landolt H, Börnstein R. Zahlenwerte und Funktionen aus Physik, Chemie, Astronomie, Geophysik und Technik Bd. II, Teil 5a. Berlin: Springer; 1950. p. 325.
Publication types
MeSH terms
Substances
LinkOut - more resources
Full Text Sources
Other Literature Sources

