. 2000 Jan;11(1):287-304.
doi: 10.1091/mbc.11.1.287.

Selective alterations in biosynthetic and endocytic protein traffic in Madin-Darby canine kidney epithelial cells expressing mutants of the small GTPase Rac1

Affiliations
Free PMC article

Selective alterations in biosynthetic and endocytic protein traffic in Madin-Darby canine kidney epithelial cells expressing mutants of the small GTPase Rac1

T S Jou et al. Mol Biol Cell. 2000 Jan.
Free PMC article

Abstract

Madin-Darby canine kidney (MDCK) cells expressing constitutively active Rac1 (Rac1V12) accumulate a large central aggregate of membranes beneath the apical membrane that contains filamentous actin, Rac1V12, rab11, and the resident apical membrane protein GP-135. To examine the roles of Rac1 in membrane traffic and the formation of this aggregate, we analyzed endocytic and biosynthetic trafficking pathways in MDCK cells expressing Rac1V12 and dominant inactive Rac1 (Rac1N17). Rac1V12 expression decreased the rates of apical and basolateral endocytosis, whereas Rac1N17 expression increased those rates from both membrane domains. Basolateral-to-apical transcytosis of immunoglobulin A (IgA) (a ligand for the polymeric immunoglobulin receptor [pIgR]), apical recycling of pIgR-IgA, and accumulation of newly synthesized GP-135 at the apical plasma membrane were all decreased in cells expressing Rac1V12. These effects of Rac1V12 on trafficking pathways to the apical membrane were the result of the delivery and trapping of these proteins in the central aggregate. In contrast to abnormalities in apical trafficking events, basolateral recycling of transferrin, degradation of EGF internalized from the basolateral membrane, and delivery of newly synthesized pIgR from the Golgi to the basolateral membrane were all relatively unaffected by Rac1V12 expression. Rac1N17 expression had little or no effect on these postendocytic or biosynthetic trafficking pathways. These results show that in polarized MDCK cells activated Rac1 may regulate the rate of endocytosis from both membrane domains and that expression of dominant active Rac1V12 specifically alters postendocytic and biosynthetic membrane traffic directed to the apical, but not the basolateral, membrane.


Figures

Figure 1
Figure 1
Inducible expression of myc-tagged Rac1V12 and Rac1N17 in polarized MDCK cells. Rac1V12 or Rac1N17 cells were plated at low density in medium lacking DC (−) or containing DC (+), incubated for 16–20 h (Rac1N17) or 36 h (Rac1V12), and then plated on Transwell filter supports (with or without DC). At the designated times, the filter-grown cells were solubilized in SDS lysis buffer and processed for Western blotting with an anti-Rac1 mAb to detect induction of the myc-tagged mutant proteins as well as endogenous Rac1. (*) The addition of the myc tag to Rac1V12 and Rac1N17 causes these proteins to migrate slower than endogenous Rac1.
Figure 2
Figure 2
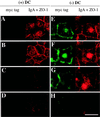
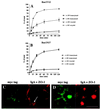
Distribution of basolaterally internalized IgA and myc-tagged Rac1V12 in cells grown in the absence (−) or presence (+) of DC. IgA was internalized from the basolateral surface for 10 min at 37°C in Rac1V12 cells grown in the presence (A–D) or absence (E–H) of DC and then washed and chased for 5 min at 37°C. Cells were fixed with paraformaldehyde and stained with the appropriate antibodies, and FITC and Cy5 emissions (which are displayed in the left and right halves of each panel, respectively) were captured with the use of a scanning laser confocal microscope. Shown are optical sections from the base of the cells (D and H), along the lateral surface of the cells (C and G), above the nucleus (B and F), and at or above the level of the tight junctions (A and E). Note that there are at least 2–3 μm between each optical section. The tight junctions are the thin red lines that surround the cell. Bar, 10 μm.
Figure 3
Figure 3
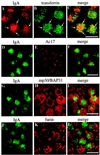
Distribution of IgA, Tf, the Ac17 antigen, mp30/BAP31, and furin in cells expressing Rac1V12. IgA was internalized from the basolateral surface of the cell for 10 min at 37°C, washed, and then chased for 60 min at 37°C. (A–C) Tf was internalized during the last 10 min of the 60-min chase. The cells were fixed, incubated with antibodies against IgA and Tf (A–C), IgA and Ac17 antigen (D–F), IgA and mp30/BAP31 (G–I), or IgA and furin (J–L) and then reacted with the appropriate secondary antibody coupled to FITC or Cy5. Arrows indicate regions of colocalization. A single optical section at the level of the central aggregate was obtained with a scanning laser confocal microscope. Bar, 10 μm.
Figure 4
Figure 4
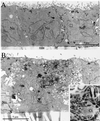
Ultrastructural analysis of Rac1V12 cells grown in the presence or absence of DC. Fab-HRP was internalized from the basolateral pole of the cell, the cells were fixed, a DAB reaction was performed, and the cells were processed for electron microscopy. (A) Cells grown in the presence of DC. (B) Cells grown in the absence of DC. Clusters of Fab-HRP–labeled structures are labeled with asterisks. The upper cluster represents ligand present in the common endosome/ARE, and the bottom cluster represents ligand present in the central aggregate. (Inset) A magnified view of the endosomal elements that constitute the central aggregate. Ct, centriole. (C) Cells grown in the absence of DC. A juxtanuclear central aggregate is shown. (Inset) A magnified view of the 10-nm filaments surrounding the endosomal elements of the central aggregate (marked with arrows). G, Golgi stacks; LF, infoldings of the lateral membrane; Nu, nucleus.
Figure 4
Figure 4
Ultrastructural analysis of Rac1V12 cells grown in the presence or absence of DC. Fab-HRP was internalized from the basolateral pole of the cell, the cells were fixed, a DAB reaction was performed, and the cells were processed for electron microscopy. (A) Cells grown in the presence of DC. (B) Cells grown in the absence of DC. Clusters of Fab-HRP–labeled structures are labeled with asterisks. The upper cluster represents ligand present in the common endosome/ARE, and the bottom cluster represents ligand present in the central aggregate. (Inset) A magnified view of the endosomal elements that constitute the central aggregate. Ct, centriole. (C) Cells grown in the absence of DC. A juxtanuclear central aggregate is shown. (Inset) A magnified view of the 10-nm filaments surrounding the endosomal elements of the central aggregate (marked with arrows). G, Golgi stacks; LF, infoldings of the lateral membrane; Nu, nucleus.
Figure 5
Figure 5
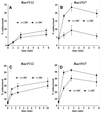
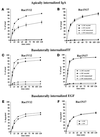
Apical and basolateral endocytosis in Rac1V12 and Rac1N17 cells. [125I]IgA was bound to the apical (A and B) or basolateral (C and D) surface of cells for 60 min at 4°C. The Rac1V12 (A and C) or Rac1N17 (B and D) cells were washed and then incubated at 37°C for the times indicated. The media were collected, and the cells were then rapidly cooled on ice. [125I]IgA was stripped from the cell surface by a sequential treatment with trypsin and acid at 4°C, and the filters were cut out of their holders. Total [125I]IgA initially bound to the cells included ligand released into the medium, ligand stripped from the cell surface with trypsin and acid, and cell-associated ligand not sensitive to stripping (endocytosed) and was quantified with a gamma counter. Shown is the percentage of total endocytosed ligand from a representative experiment (mean ± SD; n = 3).
Figure 6
Figure 6
Postendocytic fate of basolaterally internalized IgA in Rac1V12- and Rac1N17-expressing cells. [125I]IgA was internalized from the basolateral surface of the cells for 10 min at 37°C, and the cells were washed and then chased for 120 min. The percentage of total ligand released apically (transcytosed) or basolaterally (recycled) in cells expressing Rac1V12 (A) or Rac1N17 (B) is shown. Values for degradation were as follows: Rac1V12 + DC, 5.0 ± 0.7%; Rac1V12 − DC, 10.6 ± 0.7%; Rac1N17 + DC, 5.6 ± 0.3%; Rac1N17 − DC, 4.4 ± 0.5%. Values for ligand remaining cell associated were as follows: Rac1V12 + DC, 2.0 ± 0.7%; Rac1V12 − DC, 29.1 ± 6.7%; Rac1N17 + DC, 3.1 ± 0.2%; Rac1N17 − DC, 3.8 ± 1.0%. Values (mean ± SD; n = 3) are from a representative experiment. (C and D) IgA was internalized from the basolateral cell surface for 10 min at 37°C, and the cells were washed and then chased for 60 min at 37°C in ligand-free medium. The cells were fixed, incubated with antibodies against myc-tagged Rac1V12, IgA, and ZO-1, and then reacted with the appropriate secondary antibody coupled to FITC or Cy5. Single optical sections at the level of the tight junctions (C) or the central aggregate (D) were obtained with a scanning laser confocal microscope. The arrow in C demarks a cell in which some IgA is seen accumulating at the apical pole of the cell. Bar, 10 μm.
Figure 7
Figure 7
Postendocytic fate of apically internalized IgA, basolaterally internalized Tf, and basolaterally internalized EGF in cells expressing Rac1V12 or Rac1N17. (A and B) [125I]IgA was internalized from the apical surface of the cells for 10 min at 37°C, and the cells were washed and then chased for 120 min. The percentage of total ligand released apically (recycled) or basolaterally (transcytosed) in cells expressing Rac1V12 (A) or Rac1N17 (B) is shown. Values for degradation were as follows: Rac1V12 + DC, 7.6 ± 0.7%; Rac1V12 − DC, 11.3 ± 1.1%; Rac1N17 + DC, 7.3 ± 0.3%; Rac1N17 − DC, 5.2 ± 0.4%. Values for ligand remaining cell associated were as follows: Rac1V12 + DC, 5.1 ± 0.9%; Rac1V12 − DC, 28.3 ± 4.8%; Rac1N17 + DC, 4.3 ± 0.7%; Rac1N17 −DC, 7.8 ± 3.9%. Values (mean ± SD; n = 3) are from a representative experiment. (C and D) [125I]Tf was internalized from the basolateral surface of the cells for 30 min at 37°C, and the cells were washed and then chased for 120 min at 37°C. The percentage of total ligand released apically (transcytosed) or basolaterally (recycled) in cells expressing Rac1V12 (C) or Rac1N17 (D) is shown. Values for degradation were as follows: Rac1V12 + DC, 2.8 ± 0.1%; Rac1V12 − DC, 2.8 ± 0.1%; Rac1N17 + DC, 2.2 ± 0.3%; Rac1N17 − DC, 1.7 ± 0.2%. Values for ligand remaining cell associated were as follows: Rac1V12 + DC, 1.8 ± 0.2%; Rac1V12 − DC, 3.1 ± 0.4%; Rac1N17 + DC, 1.8 ± 0.6%; Rac1N17 − DC, 2.3 ± 0.6%. Values (mean ± SD; n = 4) are from a representative experiment. (E and F) [125I]EGF was internalized from the basolateral surface of the cells for 10 min at 37°C, and the cells were washed and then chased for 120 min. The percentage of total degraded ligand in cells expressing Rac1V12 (E) or Rac1N17 (F) is shown. Values for transcytosis were as follows: Rac1V12 + DC, 8.7 ± 0.7%; Rac1V12 − DC, 11.5 ± 0.8%; Rac1N17 + DC, 10.0 ± 1.2%; Rac1N17 − DC, 12.1 ± 1.0%. Values for ligand recycling were as follows: Rac1V12 + DC, 22.8 ± 1.7%; Rac1V12 − DC, 24.6 ± 0.8%; Rac1N17 + DC, 21.5 ± 0.8%; Rac1N17 − DC, 22.6 ± 1.1%. Values for ligand remaining cell associated were as follows: Rac1V12 + DC, 5.2 ± 0.5%; Rac1V12 − DC, 6.6 ± 0.5%; Rac1N17 + DC, 5.3 ± 1.0%; Rac1N17 − DC, 5.4 ± 1.0%. Values (mean ± SD; n = 4) are from a representative experiment.
Figure 8
Figure 8
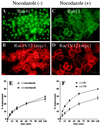
Effects of nocodazole and CD on the distribution and exit of proteins from the central aggregate. (A–D) Cells were mock treated or treated with nocodazole, fixed, incubated with antibodies against rab11 and the myc tag, and then reacted with the appropriate secondary antibody coupled to FITC or Texas red. Bar, 10 μm. (E) [125I]IgA was internalized from the basolateral surface of the cells for 10 min at 37°C, and the cells were washed and then chased for 60 min. Cells were rapidly chilled to 4°C for 60 min (with [+] or without [−] nocodazole), and the postendocytic fate of ligand was assessed in a subsequent 120-min incubation at 37°C (with or without nocodazole). The percentage of total ligand released apically (transcytosed) is shown. Values for degradation were as follows: without nocodazole, 21.0 ± 1.2%; with nocodazole, 21.9 ± 0.8%. Values for ligand remaining cell associated were as follows: without nocodazole, 36.1 ± 5.5%; with nocodazole, 37.2 ± 1.5%. (F) [125I]IgA was internalized from the basolateral surface of the cells for 10 min at 37°C, and the cells were washed and then chased for 45 min at 37°C. After a 15-min treatment with (+) or without (−) 25 μg/ml CD, the postendocytic fate of ligand was assessed in a 120-min incubation at 37°C (with or without CD). The percentage of total ligand released apically (transcytosed) is shown. Values for degradation were as follows: without CD, 10.2 ± 0.5%; with CD, 14.0 ± 1.1%. Values for ligand remaining cell associated were as follows: without CD, 46.7 ± 2.2%; with CD, 35.7 ± 1.1%. Values (mean ± SD; n = 3) are from a representative experiment.
Figure 9
Figure 9
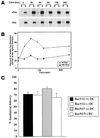
Effect of Rac1V12 expression on trafficking of newly synthesized apical proteins from the Golgi complex to the cell surface. (A and B) MDCK cells were grown in the presence (+) or absence (−) of DC (Dox) on Transwell filters. Cells were metabolically labeled for 15 min with [35S]met/cys and then chased for different times in medium containing an excess of unlabeled met/cys. For analysis of GP-135 trafficking, pairs of filters were processed for apical (A) and basolateral (B) cell surface biotinylation. Cells were extracted with buffer containing Triton X-100 to yield soluble (S) and insoluble (P) fractions, from which the biotinylated fraction of GP-135 was isolated by sequential GP-135 antibody and streptavidin-agarose precipitation. A separate filter for each time point was extracted with SDS lysis buffer, and GP-135 was immunoprecipitated directly to obtain the total amount of [35S]met/cys-labeled GP-135 in the cells. Proteins were separated by SDS-PAGE and detected subsequently with the use of a Molecular Dynamics (Sunnyvale, CA) PhosphorImager (see MATERIALS AND METHODS) (Grindstaff et al., 1998a). Kinetics of GP-135 (A and B) trafficking to the apical membrane domain are presented. Data are from a representative experiment. As shown by us previously, <5% of GP-135 is delivered to the basolateral membrane in control cells (Grindstaff et al., 1998a) and Rac1V12 cells (Fung, unpublished results); these data, therefore, are not presented. To determine the proportion of GP-135 on the apical membrane, the amount of apical biotinylated GP-135 was divided by the total amount of labeled GP-135 in the cell, and the fraction was plotted against the time of the chase (B). (C) Cells were metabolically labeled with [35S]cys for 15 min at 37°C and then chased in the presence (+) or absence (−) of basolateral trypsin for 60 min at 37°C, as described previously (Apodaca et al., 1993; Aroeti and Mostov, 1994). In the presence of trypsin, newly synthesized pIgR delivered to the basolateral cell surface was rapidly proteolyzed. By comparing the amount of immunoprecipitable pIgR in non-trypsin-treated cells and cells treated with trypsin, it is possible to quantify the extent of pIgR delivery to the basolateral cell surface (Apodaca et al., 1993; Aroeti and Mostov, 1994). The percentage of basolateral delivery is shown (mean ± SD; n = 4).

Similar articles

Cited by

References

    1. Adam T, Giry M, Boquet P, Sansonetti P. Rho-dependent membrane folding causes Shigella entry into epithelial cells. EMBO J. 1996;15:3315–3321. - PMC - PubMed
    1. Adamson P, Paterson HF, Hall A. Intracellular localization of the p21rho proteins. J Cell Biol. 1992;119:617–627. - PMC - PubMed
    1. Annaert WG, Becker B, Kistner U, Reth M, Jahn R. Export of cellubrevin from the endoplasmic reticulum is controlled by BAP31. J Cell Biol. 1997;139:1397–1410. - PMC - PubMed
    1. Apodaca G, Aroeti B, Tang K, Mostov KE. Brefeldin-A inhibits the delivery of the polymeric immunoglobulin receptor to the basolateral surface of MDCK cells. J Biol Chem. 1993;268:20380–20385. - PubMed
    1. Apodaca G, Katz LA, Mostov KE. Receptor-mediated transcytosis of IgA in MDCK cells is via apical recycling endosomes. J Cell Biol. 1994;125:67–86. - PMC - PubMed

Publication types

MeSH terms