Flexibility, conformational diversity and two dimerization modes in complexes of ribosomal protein L12
- PMID: 10637222
- PMCID: PMC305552
- DOI: 10.1093/emboj/19.2.174
Flexibility, conformational diversity and two dimerization modes in complexes of ribosomal protein L12
Abstract
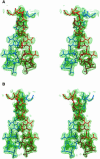
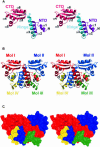
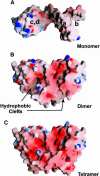
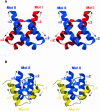
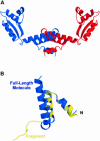
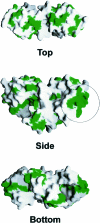
Protein L12, the only multicopy component of the ribosome, is presumed to be involved in the binding of translation factors, stimulating factor-dependent GTP hydrolysis. Crystal structures of L12 from Thermotogamaritima have been solved in two space groups by the multiple anomalous dispersion method and refined at 2.4 and 2.0 A resolution. In both crystal forms, an asymmetric unit comprises two full-length L12 molecules and two N-terminal L12 fragments that are associated in a specific, hetero-tetrameric complex with one non-crystallographic 2-fold axis. The two full-length proteins form a tight, symmetric, parallel dimer, mainly through their N-terminal domains. Each monomer of this central dimer additionally associates in a different way with an N-terminal L12 fragment. Both dimerization modes are unlike models proposed previously and suggest that similar complexes may occur in vivo and in situ. The structures also display different L12 monomer conformations, in accord with the suggested dynamic role of the protein in the ribosomal translocation process. The structures have been submitted to the Protein Databank (http://www.rcsb.org/pdb) under accession numbers 1DD3 and 1DD4.
Figures


Similar articles
-
Oligomeric state and mode of self-association of Thermotoga maritima ribosomal stalk protein L12 in solution.Biochemistry. 2005 Mar 8;44(9):3298-305. doi: 10.1021/bi048015n. Biochemistry. 2005. PMID: 15736940
-
Structure and function of the acidic ribosomal stalk proteins.Curr Protein Pept Sci. 2002 Feb;3(1):93-106. doi: 10.2174/1389203023380756. Curr Protein Pept Sci. 2002. PMID: 12370014 Review.
-
Structural investigations of the highly flexible recombinant ribosomal protein L12 from Thermotoga maritima.Biol Chem. 2000 Mar;381(3):221-9. doi: 10.1515/BC.2000.029. Biol Chem. 2000. PMID: 10782993
-
Conformation and dynamics of ribosomal stalk protein L12 in solution and on the ribosome.Biochemistry. 2004 May 25;43(20):5930-6. doi: 10.1021/bi0495331. Biochemistry. 2004. PMID: 15147176
-
Structure of a two-domain N-terminal fragment of ribosomal protein L10 from Methanococcus jannaschii reveals a specific piece of the archaeal ribosomal stalk.J Mol Biol. 2010 Jun 4;399(2):214-20. doi: 10.1016/j.jmb.2010.04.017. Epub 2010 Apr 24. J Mol Biol. 2010. PMID: 20399793 Review.
Cited by
-
Heteronuclear NMR investigations of dynamic regions of intact Escherichia coli ribosomes.Proc Natl Acad Sci U S A. 2004 Jul 27;101(30):10949-54. doi: 10.1073/pnas.0400928101. Epub 2004 Jul 19. Proc Natl Acad Sci U S A. 2004. PMID: 15263071 Free PMC article.
-
The 'Shape-Shifter' Peptide from the Disulphide Isomerase PmScsC Shows Context-Dependent Conformational Preferences.Biomolecules. 2021 Apr 26;11(5):642. doi: 10.3390/biom11050642. Biomolecules. 2021. PMID: 33926076 Free PMC article.
-
Localization and orientation of heavy-atom cluster compounds in protein crystals using molecular replacement.Acta Crystallogr D Biol Crystallogr. 2013 Feb;69(Pt 2):284-97. doi: 10.1107/S0907444912046008. Epub 2013 Jan 19. Acta Crystallogr D Biol Crystallogr. 2013. PMID: 23385464 Free PMC article.
-
The origin of eubacteria with three L7/L12 protein dimers in the ribosome.Dokl Biochem Biophys. 2008 Sep-Oct;422:257-60. doi: 10.1134/s1607672908050025. Dokl Biochem Biophys. 2008. PMID: 19024552 No abstract available.
-
Structural basis for late maturation steps of the human mitoribosomal large subunit.Nat Commun. 2021 Jun 16;12(1):3673. doi: 10.1038/s41467-021-23617-8. Nat Commun. 2021. PMID: 34135318 Free PMC article.
References
-
- Ban N., Nissen, P., Hansen, J., Capel, M., Moore, P.B. and Steitz, T.A. (1999) Placement of protein and RNA structures into a 5 Å-resolution map of the 50S ribosomal subunit. Nature, 400, 841–847. - PubMed
-
- Bargis-Surgey P., Lavergne, J.P., Gonzalo, P., Vard, C., Filhol–Cochet, O. and Reboud, J.P. (1999) Interaction of elongation factor eEF-2 with ribosomal P proteins. Eur. J. Biochem., 262, 606–611. - PubMed
-
- Barton G.J. (1993) ALSCRIPT—a tool for multiple sequence alignments. Protein Eng., 6, 37–40. - PubMed
-
- Bernstein F.C., Koetzle, T.F., Williams, G.J.B., Meyer, E.F.,Jr, Brice, M.D., Rogers, J.R., Kennard, O., Schimanouchi, T. and Tasumi, M.J. (1977) The protein data bank: a computer-based archieval file for macromolecule structures. J. Mol. Biol., 112, 535–542. - PubMed
Publication types
MeSH terms
Substances
Associated data
- Actions
- Actions
LinkOut - more resources
Full Text Sources
Molecular Biology Databases

