. 1999 Nov 29;147(5):1023-38.
doi: 10.1083/jcb.147.5.1023.

Phosphorylation of myosin-binding subunit (MBS) of myosin phosphatase by Rho-kinase in vivo

Affiliations

Phosphorylation of myosin-binding subunit (MBS) of myosin phosphatase by Rho-kinase in vivo

Y Kawano et al. J Cell Biol. .

Abstract

Rho-associated kinase (Rho-kinase), which is activated by the small GTPase Rho, phosphorylates myosin-binding subunit (MBS) of myosin phosphatase and thereby inactivates the phosphatase activity in vitro. Rho-kinase is thought to regulate the phosphorylation state of the substrates including myosin light chain (MLC), ERM (ezrin/radixin/moesin) family proteins and adducin by their direct phosphorylation and by the inactivation of myosin phosphatase. Here we identified the sites of phosphorylation of MBS by Rho-kinase as Thr-697, Ser-854 and several residues, and prepared antibody that specifically recognized MBS phosphorylated at Ser-854. We found by use of this antibody that the stimulation of MDCK epithelial cells with tetradecanoylphorbol-13-acetate (TPA) or hepatocyte growth factor (HGF) induced the phosphorylation of MBS at Ser-854 under the conditions in which membrane ruffling and cell migration were induced. Pretreatment of the cells with Botulinum C3 ADP-ribosyltransferase (C3), which is thought to interfere with Rho functions, or Rho-kinase inhibitors inhibited the TPA- or HGF-induced MBS phosphorylation. The TPA stimulation enhanced the immunoreactivity of phosphorylated MBS in the cytoplasm and membrane ruffling area of MDCK cells. In migrating MDCK cells, phosphorylated MBS as well as phosphorylated MLC at Ser-19 were localized in the leading edge and posterior region. Phosphorylated MBS was localized on actin stress fibers in REF52 fibroblasts. The microinjection of C3 or dominant negative Rho-kinase disrupted stress fibers and weakened the accumulation of phosphorylated MBS in REF52 cells. During cytokinesis, phosphorylated MBS, MLC and ERM family proteins accumulated at the cleavage furrow, and the phosphorylation level of MBS at Ser-854 was increased. Taken together, these results indicate that MBS is phosphorylated by Rho-kinase downstream of Rho in vivo, and suggest that myosin phosphatase and Rho-kinase spatiotemporally regulate the phosphorylation state of Rho-kinase substrates including MLC and ERM family proteins in vivo in a cooperative manner.


Figures

Figure 1
Figure 1
Determination of the sites of phosphorylation of MBS by Rho-kinase. Purified full-length MBS was incubated with GST-CAT in kinase buffer A containing 100 μM γ-[32P]ATP for 1 h at 30°C, and the reaction product was digested with Achromobacter protease I. The obtained peptides were applied onto a C18 reverse phase column as described in Materials and Methods.
Figure 2
Figure 2
Specificity of phosphorylation site-specific antibody (anti-pS854 Ab). (A) Recognition of MBS phosphorylated at Ser-854. A total of 200 fmol of GST-MBS-CT (CT: 758–1032 aa) containing the indicated amounts of GST-MBS-CT phosphorylated by GST-CAT and 200 fmol of GST-MBS-CTS854A, T855A (AA) and GST-MBS-NT (NT: 1–763 aa) phosphorylated by GST-CAT were resolved by SDS-PAGE followed by immunoblotting with anti-pS854 Ab (upper panels), anti-pS854 Ab absorbed with a 100-fold amount of antigen phosphopeptide (middle panels) or anti-pnMBS or pcMBS Ab (lower panels). (B) Specific recognition of MBS phosphorylated by Rho-kinase. A total of 4 pmol of full-length MBS (1–1032 aa) phosphorylated by GST-CAT (CAT) or PKC was resolved by SDS-PAGE followed by immunoblotting with anti-pS854 Ab (upper panel) or anti-pnMBS Ab (lower panel) or by autoradiography (middle panel). The arrowhead indicates the position of MBS phosphorylated at Ser-854. These results are representative of three independent experiments.
Figure 3
Figure 3
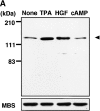
Rho- and Rho-kinase–dependent phosphorylation of MBS at Ser-854 in MDCK cells. (A) TPA- and HGF-induced phosphorylation of MBS at Ser-854. Serum-deprived MDCK cells were stimulated with 200 nM TPA, 50 pM HGF for 15 min or 5 mM dibutyryl cAMP (cAMP) for 30 min, and the whole-cell lysates were resolved by SDS-PAGE followed by immunoblotting with anti-pS854 Ab (upper panel) and anti-pnMBS Ab (lower panel). Arrowhead indicates the position of MBS phosphorylated at Ser-854. A minor band with apparent relative molecular mass of 90 kD may be a degradation product of MBS. (B) Time course of the phosphorylation of MBS at Ser-854 in the TPA- and HGF-stimulated MDCK cells. Serum-deprived MDCK cells were stimulated with 200 nM TPA (a) or 50 pM HGF (b) for 3, 5, 15, 30, 60, or 120 min, and the whole-cell lysates were resolved by SDS-PAGE followed by immunoblotting with anti-pS854 Ab (upper panels) and anti-pnMBS Ab (lower panels). The amount of MBS phosphorylated at Ser-854 was quantitatively determined by scanning densitometry. The densities of the immunoreactive bands with anti-pS854 Ab were normalized by that of total MBS. The mean density of the immunoreactive bands with anti-pS854 Ab at 0 min was set at 100 arbitrary units. The values shown are means ± SE of triplicates. (C) Inhibition of the TPA- and HGF-induced MBS phosphorylation by C3 or Rho-kinase inhibitors. Nonpretreated (2), 50 or 100 μg/ml C3-pretreated (3 and 4), 1 or 10 μM of HA1077-pretreated (5 and 6), or 1 or 10 μM of Y-32885–pretreated (7 and 8) serum-deprived MDCK cells were stimulated with (2–8) or without (1) 200 nM TPA (a) or 50 pM HGF (b) for 15 min and the lysates were resolved by SDS-PAGE followed by immunoblotting with anti-pS854 Ab (upper panels) and anti-pnMBS Ab (lower panels). The densities of the immunoreactive bands with anti-pS854 Ab were normalized by that of total MBS. The mean density of the immunoreactive bands with anti-pS854 Ab in the nonstimulated cells was set at 100 arbitrary units. The values shown are means ± SE of triplicates.
Figure 3
Figure 3
Rho- and Rho-kinase–dependent phosphorylation of MBS at Ser-854 in MDCK cells. (A) TPA- and HGF-induced phosphorylation of MBS at Ser-854. Serum-deprived MDCK cells were stimulated with 200 nM TPA, 50 pM HGF for 15 min or 5 mM dibutyryl cAMP (cAMP) for 30 min, and the whole-cell lysates were resolved by SDS-PAGE followed by immunoblotting with anti-pS854 Ab (upper panel) and anti-pnMBS Ab (lower panel). Arrowhead indicates the position of MBS phosphorylated at Ser-854. A minor band with apparent relative molecular mass of 90 kD may be a degradation product of MBS. (B) Time course of the phosphorylation of MBS at Ser-854 in the TPA- and HGF-stimulated MDCK cells. Serum-deprived MDCK cells were stimulated with 200 nM TPA (a) or 50 pM HGF (b) for 3, 5, 15, 30, 60, or 120 min, and the whole-cell lysates were resolved by SDS-PAGE followed by immunoblotting with anti-pS854 Ab (upper panels) and anti-pnMBS Ab (lower panels). The amount of MBS phosphorylated at Ser-854 was quantitatively determined by scanning densitometry. The densities of the immunoreactive bands with anti-pS854 Ab were normalized by that of total MBS. The mean density of the immunoreactive bands with anti-pS854 Ab at 0 min was set at 100 arbitrary units. The values shown are means ± SE of triplicates. (C) Inhibition of the TPA- and HGF-induced MBS phosphorylation by C3 or Rho-kinase inhibitors. Nonpretreated (2), 50 or 100 μg/ml C3-pretreated (3 and 4), 1 or 10 μM of HA1077-pretreated (5 and 6), or 1 or 10 μM of Y-32885–pretreated (7 and 8) serum-deprived MDCK cells were stimulated with (2–8) or without (1) 200 nM TPA (a) or 50 pM HGF (b) for 15 min and the lysates were resolved by SDS-PAGE followed by immunoblotting with anti-pS854 Ab (upper panels) and anti-pnMBS Ab (lower panels). The densities of the immunoreactive bands with anti-pS854 Ab were normalized by that of total MBS. The mean density of the immunoreactive bands with anti-pS854 Ab in the nonstimulated cells was set at 100 arbitrary units. The values shown are means ± SE of triplicates.
Figure 4
Figure 4
Distribution of Ser-854–phosphorylated MBS in the TPA- or HGF-stimulated MDCK cells. (A) Distribution of Ser-854–phosphorylated MBS. Serum-deprived MDCK cells were stimulated with 200 nM TPA (c, d, and h) or 50 pM HGF (e and f) for 15 min. MDCK cells were stained with anti-pS854 Ab (a, c, and e) or TRITC-phalloidin (b, d, and f). MDCK cells were also stained with anti-pS854 Ab absorbed with a 100-fold amount of antigen phosphopeptide (g and h). Arrowheads indicate the induced membrane ruffling. (B) Distribution of phosphorylated and total MBS. Serum-deprived MDCK cells were stimulated with 200 nM TPA (e–h) or 50 pM HGF (i–l) for 15 min. MDCK cells were doubly stained with anti-pS854 Ab (a, e, and i) and anti-mMBS Ab (b, f, and j). The merged (c, g, and k) and ratio (phosphorylated MBS/MBS; d, h, and l) images are shown. (C) Subcellular distribution of phosphorylated MBS. Non- (−) and TPA- (+) stimulated MDCK cells were separated into nuclear (nucleus), cytoplasmic (cytoplasm), and membrane (membrane) fractions, and the fractions were immunoblotted with anti-pS854 Ab (upper panel) and anti-pnMBS Ab (lower panel). These results are representative of three independent experiments. Bars, 10 μm.
Figure 4
Figure 4
Distribution of Ser-854–phosphorylated MBS in the TPA- or HGF-stimulated MDCK cells. (A) Distribution of Ser-854–phosphorylated MBS. Serum-deprived MDCK cells were stimulated with 200 nM TPA (c, d, and h) or 50 pM HGF (e and f) for 15 min. MDCK cells were stained with anti-pS854 Ab (a, c, and e) or TRITC-phalloidin (b, d, and f). MDCK cells were also stained with anti-pS854 Ab absorbed with a 100-fold amount of antigen phosphopeptide (g and h). Arrowheads indicate the induced membrane ruffling. (B) Distribution of phosphorylated and total MBS. Serum-deprived MDCK cells were stimulated with 200 nM TPA (e–h) or 50 pM HGF (i–l) for 15 min. MDCK cells were doubly stained with anti-pS854 Ab (a, e, and i) and anti-mMBS Ab (b, f, and j). The merged (c, g, and k) and ratio (phosphorylated MBS/MBS; d, h, and l) images are shown. (C) Subcellular distribution of phosphorylated MBS. Non- (−) and TPA- (+) stimulated MDCK cells were separated into nuclear (nucleus), cytoplasmic (cytoplasm), and membrane (membrane) fractions, and the fractions were immunoblotted with anti-pS854 Ab (upper panel) and anti-pnMBS Ab (lower panel). These results are representative of three independent experiments. Bars, 10 μm.
Figure 5
Figure 5
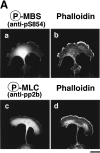
Distribution of phosphorylated MBS in migrating MDCK cells. (A) Serum-deprived MDCK cells were stimulated with 200 nM TPA for 2 h. Migrating MDCK cells were doubly stained with TRITC-phalloidin (b and d) and anti-pS854 Ab (a) or anti-pp2b Ab (c). (B) Localization of phosphorylated and total MBS in migrating MDCK cells. Migrating cells were doubly stained with anti-pS854 Ab (a) and anti-mMBS Ab (b). The merged (c) and ratio (phosphorylated MBS/MBS; d) images are shown. Bars, 10 μm.
Figure 5
Figure 5
Distribution of phosphorylated MBS in migrating MDCK cells. (A) Serum-deprived MDCK cells were stimulated with 200 nM TPA for 2 h. Migrating MDCK cells were doubly stained with TRITC-phalloidin (b and d) and anti-pS854 Ab (a) or anti-pp2b Ab (c). (B) Localization of phosphorylated and total MBS in migrating MDCK cells. Migrating cells were doubly stained with anti-pS854 Ab (a) and anti-mMBS Ab (b). The merged (c) and ratio (phosphorylated MBS/MBS; d) images are shown. Bars, 10 μm.
Figure 6
Figure 6
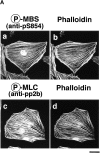
Colocalization of phosphorylated MBS, F-actin and phosphorylated MLC in REF52 fibroblasts. (A) Localization of phosphorylated MBS. REF52 cells were doubly stained with TRITC-phalloidin (b and d) and anti-pS854 Ab (a) or anti-pp2b Ab (c). (B) Distribution of phosphorylated and total MBS in REF52 cells. REF52 cells were doubly stained with anti-pS854 Ab (a) and anti-mMBS Ab (b). The merged (c) and ratio (phosphorylated MBS/MBS; d) images are shown. (C) Inhibition of phosphorylation of MBS by C3 or dominant negative Rho-kinase. REF52 cells were microinjected with MBP (5.0 mg/ml) (a–d), C3 (0.1 mg/ml) (e–h), C3 plus GTPγS·RhoAI41 (0.4 mg/ml) (i–l), or MBP-RB/PH(TT) (5.0 mg/ml) (m–p). REF52 cells were stained with TRITC-phalloidin (a, e, i, and m), anti-pS854 Ab (b, f, j, and n), anti-pnMBS Ab (c, g, k, and o), and anti-pp2b Ab (d, h, l, and p). The arrowheads indicate the injected cells. Bars, 10 μm.
Figure 6
Figure 6
Colocalization of phosphorylated MBS, F-actin and phosphorylated MLC in REF52 fibroblasts. (A) Localization of phosphorylated MBS. REF52 cells were doubly stained with TRITC-phalloidin (b and d) and anti-pS854 Ab (a) or anti-pp2b Ab (c). (B) Distribution of phosphorylated and total MBS in REF52 cells. REF52 cells were doubly stained with anti-pS854 Ab (a) and anti-mMBS Ab (b). The merged (c) and ratio (phosphorylated MBS/MBS; d) images are shown. (C) Inhibition of phosphorylation of MBS by C3 or dominant negative Rho-kinase. REF52 cells were microinjected with MBP (5.0 mg/ml) (a–d), C3 (0.1 mg/ml) (e–h), C3 plus GTPγS·RhoAI41 (0.4 mg/ml) (i–l), or MBP-RB/PH(TT) (5.0 mg/ml) (m–p). REF52 cells were stained with TRITC-phalloidin (a, e, i, and m), anti-pS854 Ab (b, f, j, and n), anti-pnMBS Ab (c, g, k, and o), and anti-pp2b Ab (d, h, l, and p). The arrowheads indicate the injected cells. Bars, 10 μm.
Figure 7
Figure 7
Distribution of phosphorylated MBS and ERM family proteins during cytokinesis in MDCK cells. (A) Accumulation of phosphorylated MBS and ERM family proteins at the cleavage furrow. MDCK cells in late anaphase (a, d, g, j, m, and p), telophase (b, e, h, k, n, and q) or cytokinesis (c, f, i, l, o, and r; indicated by arrowheads) stained with anti-pS854 Ab (a–c), anti-pp2b Ab (g–i), or anti-pT558 Ab (m–o) are shown. DNAs were stained with bisbenzimide Hoechst (d–f, j–l, and p–r). (B) Specific localization of phosphorylated Rho-kinase substrates during cytokinesis. MDCK cells in cytokinesis doubly stained with TM71 (b, e, h, k, and n) and anti-pnMBS Ab (a), anti-pS854 Ab (d), anti-ERM Ab (g), anti-pT558 Ab (j), and anti-pT445 Ab (m). Merged images are shown (c, f, i, l, and o). (C) Elevation of phosphorylation of MBS at Ser-854 during cytokinesis. Total cell lysates were prepared from interphase cells (I), early mitotic cells (metaphase, M) and cells at different stages of cell division (time in minutes after the release of mitotic arrest), and immunoblotted with anti-pS854 Ab (upper panel) or anti-pnMBS Ab (lower panel). These results are representative of three independent experiments. Bars, 10 μm.
Figure 7
Figure 7
Distribution of phosphorylated MBS and ERM family proteins during cytokinesis in MDCK cells. (A) Accumulation of phosphorylated MBS and ERM family proteins at the cleavage furrow. MDCK cells in late anaphase (a, d, g, j, m, and p), telophase (b, e, h, k, n, and q) or cytokinesis (c, f, i, l, o, and r; indicated by arrowheads) stained with anti-pS854 Ab (a–c), anti-pp2b Ab (g–i), or anti-pT558 Ab (m–o) are shown. DNAs were stained with bisbenzimide Hoechst (d–f, j–l, and p–r). (B) Specific localization of phosphorylated Rho-kinase substrates during cytokinesis. MDCK cells in cytokinesis doubly stained with TM71 (b, e, h, k, and n) and anti-pnMBS Ab (a), anti-pS854 Ab (d), anti-ERM Ab (g), anti-pT558 Ab (j), and anti-pT445 Ab (m). Merged images are shown (c, f, i, l, and o). (C) Elevation of phosphorylation of MBS at Ser-854 during cytokinesis. Total cell lysates were prepared from interphase cells (I), early mitotic cells (metaphase, M) and cells at different stages of cell division (time in minutes after the release of mitotic arrest), and immunoblotted with anti-pS854 Ab (upper panel) or anti-pnMBS Ab (lower panel). These results are representative of three independent experiments. Bars, 10 μm.

Similar articles

Cited by

References

    1. Alessi D., MacDougall L.K., Sola M.M., Ikebe M., Cohen P. The control of protein phosphatase-1 by targeting subunits. The major myosin phosphatase in avian smooth muscle is a novel form of protein phosphatase-1. Eur. J. Biochem. 1992;210:1023–1035. - PubMed
    1. Amano M., Ito M., Kimura K., Fukata Y., Chihara K., Nakano T., Matsuura Y., Kaibuchi K. Phosphorylation and activation of myosin by Rho-associated kinase (Rho-kinase) J. Biol. Chem. 271 1996. 20246 20249a - PubMed
    1. Amano M., Mukai H., Ono Y., Chihara K., Matsui T., Hamajima Y., Okawa K., Iwamatsu A., Kaibuchi K. Identification of a putative target for Rho as a serine-threonine kinase, PKN Science. 271 1996. 648 650b - PubMed
    1. Amano M., Chihara K., Kimura K., Fukata Y., Nakamura N., Matsuura Y., Kaibucni K. Formation of actin stress fibers and focal adhesions enhanced by Rho-kinase. Science. 1997;275:1308–1311. - PubMed
    1. Amano M., Chihara K., Nakamura N., Fukata Y., Yano T., Shibata M., Ikebe M., Kaibuchi K. Myosin II activation promotes neurite retraction during the action of Rho and Rho-kinase. Genes Cells. 1998;3:177–188. - PubMed

Publication types

MeSH terms