. 1999 Dec;19(12):8146-57.
doi: 10.1128/MCB.19.12.8146.

A ligand binding domain mutation in the mouse glucocorticoid receptor functionally links chromatin remodeling and transcription initiation

Affiliations

A ligand binding domain mutation in the mouse glucocorticoid receptor functionally links chromatin remodeling and transcription initiation

L A Sheldon et al. Mol Cell Biol. 1999 Dec.

Abstract

We utilized the mouse mammary tumor virus (MMTV) long terminal repeat (LTR) in vivo to understand how the interaction of the glucocorticoid receptor (GR) with a nucleosome-assembled promoter allows access of factors required for the transition from a repressed promoter to a derepressed, transcriptionally competent promoter. A mutation (C644G) in the ligand binding domain (LBD) of the mouse GR has provided information regarding the steps required in the derepression/activation process and in the functional significance of the two major transcriptional activation domains, AF1 and AF2. The mutant GR activates transcription from a transiently transfected promoter that has a disordered nucleosomal structure, though significantly less well than the wild-type GR. With an integrated, replicated promoter, which is assembled in an ordered nucleosomal array, the mutant GR does not activate transcription, and it fails to induce chromatin remodeling of the MMTV LTR promoter, as indicated by nuclease accessibility assays. Together, these findings support a two-step model for the transition of a nucleosome-assembled, repressed promoter to its transcriptionally active, derepressed form. In addition, we find that the C-terminal GR mutation is dominant over the transcription activation function of the N-terminal GR activation domain. These findings suggest that the primary activation function of the C-terminal activation domain is different from the function of the N-terminal activation domain and that it is required for derepression of the chromatin-repressed MMTV promoter.


Figures
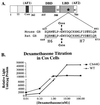
FIG. 1
FIG. 1
(A) Domain structure of steroid nuclear receptors. The hatched box represents the amino-terminal activation domain (AF1), and the darker hatched box represents the core activation domain. The checked box indicates the DNA binding domain (DBD), and the shaded box represents the carboxy-terminal LBD. The asterisk indicates the approximate location of the C644G mutation. The two regions in the C-terminal domain that have transcription activation potential are indicated by t2 and tC or AF2. Numbers indicate amino acid numbers in the mouse GR. The amino acid sequence surrounding the C644G mutation is also shown in comparison with the homologous sequence in the rat GR. Some of the residues that differ in the two sequences are in boldface. H6 and H7 represent the predicted boundaries of those α helices in the LBD based on crystal structures of other members of the nuclear receptor family. (B) Hormone titration curve of C644G versus wtGR. Cos-7 cells were transfected with 5 μg of either pCI-nH6HA-C644G or pCI-nH6HA-wtGR. Approximately 16 h following transfection, the cells were treated with the indicated amount of Dex for 6 h. Cells were harvested and assayed for luciferase activity. The number of receptors per cell was calculated by whole-cell binding of [3H]TA (see Materials and Methods). There were threefold more C644G receptors per cell than wtGRs. The data have been normalized for this difference. Note the break in the vertical scale where lower values are expanded relative to upper values.
FIG. 2
FIG. 2
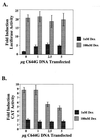
(A) Titration of the C644G receptor. 1471.1 cells were transfected with the indicated amount of C644G plasmid DNA along with 10 μg of pLTRluc and 5 μg of pCMV-IL2R DNA. Twelve to sixteen hours posttransfection, the cells were treated with 0, 1, or 100 nM Dex for 4 h. Cells were magnetically sorted, and lysates were analyzed for luciferase and CAT activity. Data are expressed as fold induction over basal activity at 0 nM Dex. At 1 nM Dex, only C644G is more active than wtGR; at 100 nM Dex, both C644G and the endogenous GR are activated. Fold induction was calculated by dividing activity at either 1 or 100 nM Dex by the activity in cells treated with vehicle (ethanol) only (0 nM Dex). Error bars represent standard error of the mean with n = 12 to 16. (B) The lysates used for panel A were assayed for CAT activity; 5 μg of total protein was used in the CAT assays, and reaction mixtures were incubated for 30 min at 37°C. Thin-layer chromatography was used to separate the acetylated forms of chloramphenicol, and PhosphorImager analysis was used for quantitation (ImageQuant; Molecular Dynamics). Fold induction is activity over basal induction from cells treated with vehicle (ethanol) only.
FIG. 3
FIG. 3
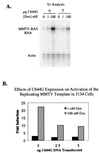
(A) S1 analysis of 3134 cells. An 8% denaturing polyacrylamide gel was used to analyze mRNA in 3134 cells following treatment with Dex. Cells were transfected with either 0 (vehicle), 2.5 (not shown), or 5 μg of C644G DNA as indicated and treated with 0, 1, or 100 nM Dex as for Fig. 2. Two radiolabeled probes were used for mRNA protection, MMTV-Ras (stably integrated reporter) and actin F (control). (B) Quantitation of the gel in panel A by PhosphorImager analysis and ImageQuant. The zero Dex value was used as the baseline for each amount of C644G transfected. All values were normalized for loading differences based on the actin band.
FIG. 4
FIG. 4
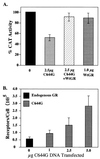
(A) Complementation of C644G by wtGR. 1471.1 cells were not transfected (0) or transfected with 2.5 μg of pCI-nH6HA-C644G DNA (C644G) alone or with 2.5 μg of C644G plus 0.5 μg of pCI-nH6HA-wtGR (WtGR) or 1 μg of wtGR alone, as indicated, as well as 5 μg pCMV-IL2R DNA. Cells were treated with vehicle (ethanol) or 100 nM Dex for 4 h, magnetically sorted, lysed, and assayed for CAT activity. Data are expressed as percent CAT activity above or below the sample with endogenous GR alone (no transfected DNA) at 100 nM Dex (solid bar). Error bars represent standard errors of the means with three to six points per treatment. (B) Whole-cell binding assays to determine the number of receptors per cell. 1471.1 cells were transfected with the indicated amount of pCI-nH6HA-C644G DNA and 5 μg of pCMV-IL2R DNA and allowed to recover 16 to 20 h. Cells were harvested, sorted, and assayed as described in Methods and Materials. In each whole-cell binding assay, the number of receptors in untransfected cells (endogenous receptors) was subtracted from the number of receptors in the C644G-transfected cells. Error bars represent standard errors of the means (n = 5 to 8).
FIG. 5
FIG. 5
(A) Representation of the B nucleosome region of the MMTV LTR. The oligonucleotide used for PCR primer extension is indicated and extends from bases +1 to +27 of the MMTV coding region. The SacI and DpnII sites are indicated at −105 (SacI) and −113 (DpnII), as are the four GREs and the NF-1 and OTF binding sites. Numbers indicate base pairs of DNA with +1 as the transcription start site. (B) Nuclease hypersensitivity assays to evaluate whether chromatin was accessible with increasing amounts of C644G transfected into the cells. SacI digests were done on nuclei treated for 1 h with Dex and isolated from 3134 cells transfected with the indicated amount of C644G DNA and 5 μg of pCMV-IL2R DNA to allow magnetic sorting. Aliquots of nuclei containing 100 μg of DNA were subjected to digestion with the restriction enzyme SacI (10 U/μg) for 15 min at 30°C. Genomic DNA was isolated and digested to completion with 5 U of DpnII/μg of DNA. PCR primer extension reactions were run with the radiolabeled primer described above. Reaction products were resolved on 8% denaturing polyacrylamide gels with the SacI band migrating at 132 bp and the DpnII band migrating at 140 bp. (C) Gel analysis with the PhosphorImager program ImageQuant (Molecular Dynamics). Fractional SacI cleavage was calculated as the ratio of the amount of SacI digestion product to the total amount of digestion products (SacI plus DpnII). The change in percent SacI cleavage was calculated by subtracting the fractional cleavage observed in the absence of Dex from that in the presence of Dex. The standard errors of the means represent data from three separate experiments per treatment.
FIG. 6
FIG. 6
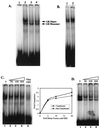
(A) C644G can bind to a GRE by EMSA. Lane 1, free GRE (probe) (described in Methods and Materials) end labeled with 32P; lane 2, 10 μg of nuclear extract from C644G-transfected cells treated with 1 nM Dex; lane 3, 10 μg of nuclear extract from nontransfected cells treated with 1 nM Dex; lane 4, 10 μg of cytosolic extract from transfected cells treated with 1 nM Dex. Arrows indicate shifted bands corresponding to the GR monomer (lower) and dimer (upper). (B) As more receptor is added to shifts, the dimerized form of the GR becomes the predominant band. In lane 1, 10 μg of nuclear extract from nontransfected 1471.1 cells treated with 1 nM Dex was incubated with the radiolabeled GRE; in lane 2, 20 μg of the same nuclear extract was incubated with the labeled GRE. (C) Competition for binding with unlabeled GRE with nuclear extracts from C644G-transfected 1471.1 cells. In lanes 1 to 4, no competitor to 20-fold excess unlabeled GRE was incubated with 10 μg nuclear extract from C644G-transfected cells treated with 1 nM Dex and 32P-labeled GRE; lane 5 shows a shift with radiolabeled mutant (Mut) GRE and the same nuclear extract used in the competitions. The inset shows the amount of competition at the indicated molar excess of unlabeled GRE in each lane of the gels shown in panels C and D. (D) Binding competition as for panel C except that nuclear extracts were prepared from untransfected 1471.1 cells. Quantitation in the untransfected cells was of the dimerized band.
FIG. 7
FIG. 7
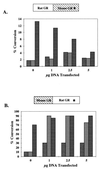
(A) 1471.1 cells were transfected with 0, 1, 2.5, or 5 μg of the rat-mouse chimera that carries the C-terminal mutation C644G indicated by an asterisk. The cells were induced with 0, 1, or 100 nM Dex for 4 h, sorted, and lysed; 5 μg of total protein was used to measure CAT activity. Assay mixtures were incubated for 30 min at 37°C. Thin-layer chromatography was used to separate the acetylated forms of chloramphenicol, and PhosphorImager analysis (ImageQuant; Molecular Dynamics) was used for quantitation. Solid bars, cells treated with vehicle only; hatched bars, cells treated with 1 nM Dex; cross-hatched bars, cells treated with 100 nM Dex. (B) 1471.1 cells were transfected with the mouse-rat chimera that carries the C656G mutation in the rat C-terminal domain, treated, and assayed as described above.

Similar articles

Cited by

References

    1. Almhöf T, Wallberg A E, Gustafsson J-Å, Wright A P H. Role of important hydrophobic amino acids in the interaction between the glucocorticoid receptor t1-core activation domain and target factors. Biochemistry. 1998;37:9586–9594. - PubMed
    1. Archer T K, Cordingley M G, Marsaud V, Richard-Foy H, Hager G L. Proceedings: Second International CBT Symposium on the Steroid/Thyroid Receptor Family and Gene Regulation. Berlin: Birkhauser Verlag AG; 1989. pp. 221–238.
    1. Archer T K, Cordingley M G, Wolford R G, Hager G L. Transcription factor access is mediated by accurately positioned nucleosomes on the mouse mammary tumor virus promoter. Mol Cell Biol. 1991;11:688–698. - PMC - PubMed
    1. Archer T K, Lee H-L, Cordingley M G, Mymryk J S, Fragoso G, Berard D S, Hager G L. Differential steroid hormone induction of transcription from the mouse mammary tumor virus promoter. Mol Endocrinol. 1994;8:568–576. - PubMed
    1. Archer T K, Lefebvre P, Wolford R G, Hager G L. Transcription factor loading on the MMTV promoter: a bimodal mechanism for promoter activation. Science. 1992;255:1573–1576. - PubMed

Publication types

MeSH terms

LinkOut - more resources