. 1999 Nov 15;190(10):1375-82.
doi: 10.1084/jem.190.10.1375.

A proinflammatory cytokine inhibits p53 tumor suppressor activity

Affiliations

A proinflammatory cytokine inhibits p53 tumor suppressor activity

J D Hudson et al. J Exp Med. .

Abstract

p53 has a key role in the negative regulation of cell proliferation, in the maintenance of genomic stability, and in the suppression of transformation and tumorigenesis. To identify novel regulators of p53, we undertook two functional screens to isolate genes which bypassed either p53-mediated growth arrest or apoptosis. In both screens, we isolated cDNAs encoding macrophage migration inhibitory factor (MIF), a cytokine that was shown previously to exert both local and systemic proinflammatory activities. Treatment with MIF overcame p53 activity in three different biological assays, and suppressed its activity as a transcriptional activator. The observation that a proinflammatory cytokine, MIF, is capable of functionally inactivating a tumor suppressor, p53, may provide a link between inflammation and tumorigenesis.


Figures

Figure 1
Figure 1
MIF treatment overcomes p53-induced growth arrest. (A) Expression of MIF bypasses p53-induced growth arrest and allows colony formation in a tetracycline-inducible GFP-p53 cell line. pH Mpv, HygroMarx I-based provirus; HMpv-MIF, HygroMarx I-based provirus expressing human MIF; DOX, 1 μg/ml doxycycline. (B) Recombinantly produced MBP-MIF before (lane 1) and after cleavage (lane 2). No contaminating bands were observed in Coomassie blue or Sypro orange–stained gels. (C) Addition of 150 ng/ml soluble rMIF bypasses p53-induced growth arrest of a tetracycline-inducible GFP-p53 cell line.
Figure 1
Figure 1
MIF treatment overcomes p53-induced growth arrest. (A) Expression of MIF bypasses p53-induced growth arrest and allows colony formation in a tetracycline-inducible GFP-p53 cell line. pH Mpv, HygroMarx I-based provirus; HMpv-MIF, HygroMarx I-based provirus expressing human MIF; DOX, 1 μg/ml doxycycline. (B) Recombinantly produced MBP-MIF before (lane 1) and after cleavage (lane 2). No contaminating bands were observed in Coomassie blue or Sypro orange–stained gels. (C) Addition of 150 ng/ml soluble rMIF bypasses p53-induced growth arrest of a tetracycline-inducible GFP-p53 cell line.
Figure 2
Figure 2
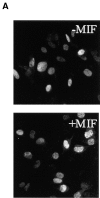
MIF suppresses the transcriptional activity of p53. (A) Subcellular localization of GFP-p53 in the presence or absence of MIF. GFP-p53 shows normal nuclear localization in each case. (B and C) Levels of GFP-p53 protein, and p21 and cyclin G mRNA after induction of GFP-p53 in the presence or absence of MIF. Data shown in C are averages from three independent experiments. (D) Levels of GFP-p53 and MDM2 protein before or 10 h after induction of GFP-p53 in the presence or absence of MIF. (E) p53-responsive luciferase reporter gene expression in the presence or absence of MIF after p53 induction. MIF treatment suppresses reporter gene expression. Data shown are averages from four independent experiments.
Figure 2
Figure 2
MIF suppresses the transcriptional activity of p53. (A) Subcellular localization of GFP-p53 in the presence or absence of MIF. GFP-p53 shows normal nuclear localization in each case. (B and C) Levels of GFP-p53 protein, and p21 and cyclin G mRNA after induction of GFP-p53 in the presence or absence of MIF. Data shown in C are averages from three independent experiments. (D) Levels of GFP-p53 and MDM2 protein before or 10 h after induction of GFP-p53 in the presence or absence of MIF. (E) p53-responsive luciferase reporter gene expression in the presence or absence of MIF after p53 induction. MIF treatment suppresses reporter gene expression. Data shown are averages from four independent experiments.
Figure 3
Figure 3
MIF treatment overcomes p53-dependent apoptosis in fibroblasts and macrophages. (A) Apoptosis in Rat-1/mycER cells. Rat-1/mycER cells expressing LacZ, MIF, or Bcl2 cDNAs were shifted to media containing 0.1% FBS plus 0.1 μM estradiol to induce apoptosis. After 24 h, cells were stained with Hoechst 33342 and scored. Cells containing condensed or fragmented DNA cells were scored as apoptotic cells. (B) RAW264.7 macrophages were pretreated with varying concentrations of MIF for 24 h, and then treated with 250 μM or 1 mM SNP. Apoptotic nuclei were scored after 2 d. (C) RAW264.7 macrophages were pretreated with MIF for 16 h, treated with SNP or GSNO for 8 h, and apoptotic cells were scored. 1, 0.5 mM SNP; 2, 1.0 mM SNP; 3, 0.5 mM GSNO; 4, 1.0 mM GSNO; 5, no treatment.
Figure 3
Figure 3
MIF treatment overcomes p53-dependent apoptosis in fibroblasts and macrophages. (A) Apoptosis in Rat-1/mycER cells. Rat-1/mycER cells expressing LacZ, MIF, or Bcl2 cDNAs were shifted to media containing 0.1% FBS plus 0.1 μM estradiol to induce apoptosis. After 24 h, cells were stained with Hoechst 33342 and scored. Cells containing condensed or fragmented DNA cells were scored as apoptotic cells. (B) RAW264.7 macrophages were pretreated with varying concentrations of MIF for 24 h, and then treated with 250 μM or 1 mM SNP. Apoptotic nuclei were scored after 2 d. (C) RAW264.7 macrophages were pretreated with MIF for 16 h, treated with SNP or GSNO for 8 h, and apoptotic cells were scored. 1, 0.5 mM SNP; 2, 1.0 mM SNP; 3, 0.5 mM GSNO; 4, 1.0 mM GSNO; 5, no treatment.
Figure 4
Figure 4
(A) Primary MEFs show extended life span in the presence of 200 ng/ml rMIF. Cells one passage before senescence were plated in the presence and absence of MIF, and stained after 15 d. Numerous colonies were formed only in the presence of MIF. (B) Dose dependency of MIF treatment in inducing extended life span. Primary cells, as in A, were grown in the presence of varying concentrations of MIF. After 17 d, cells were crystal violet stained, and washed. Resolubilized crystal violet was assayed as a measure of cell density.
Figure 4
Figure 4
(A) Primary MEFs show extended life span in the presence of 200 ng/ml rMIF. Cells one passage before senescence were plated in the presence and absence of MIF, and stained after 15 d. Numerous colonies were formed only in the presence of MIF. (B) Dose dependency of MIF treatment in inducing extended life span. Primary cells, as in A, were grown in the presence of varying concentrations of MIF. After 17 d, cells were crystal violet stained, and washed. Resolubilized crystal violet was assayed as a measure of cell density.
Figure 5
Figure 5
MIF biological activity correlates with suppression of p53-mediated target gene expression. Primary MEFs expressing MIF (vMIF), an antisense directed against p53 (p53αs), control vector (vector), or treated with rMIF were plated in passage 5. 15 d after plating cells were (A) fixed and stained with crystal violet or (B) lysed, and extracts were probed for p53, Bax, or p21 expression by Western blot.
Figure 5
Figure 5
MIF biological activity correlates with suppression of p53-mediated target gene expression. Primary MEFs expressing MIF (vMIF), an antisense directed against p53 (p53αs), control vector (vector), or treated with rMIF were plated in passage 5. 15 d after plating cells were (A) fixed and stained with crystal violet or (B) lysed, and extracts were probed for p53, Bax, or p21 expression by Western blot.

Comment in

Similar articles

Cited by

References

    1. Ko L.J., Prives C. p53puzzle and paradigm. Genes Dev. 1996;10:1054–1072. - PubMed
    1. Hansen R., Oren M. p53from inductive signal to cellular effect. Curr. Opin. Genet. Dev. 1997;7:46–51. - PubMed
    1. Maltzman W., Czyzyk L. UV irradiation stimulates levels of p53 cellular tumor antigen in nontransformed mouse cells. Mol. Cell Biol. 1981;4:1689–1694. - PMC - PubMed
    1. Kastan M.B., Onyekwere O., Sidransky D., Vogelstein B., Craig R.W. Participation of p53 protein in the cellular response to DNA damage. Cancer Res. 1991;51:6304–6311. - PubMed
    1. Yonish-Rouach E., Resnitzky D., Lotem J., Sachs L., Kimchi A., Oren M. Wild-type p53 induces apoptosis of myeloid leukaemic cells that is inhibited by interleukin-6. Nature. 1991;353:345–347. - PubMed

Publication types

Substances