Role of DNA mismatch repair and p53 in signaling induction of apoptosis by alkylating agents
- PMID: 10485900
- PMCID: PMC17957
- DOI: 10.1073/pnas.96.19.10764
Role of DNA mismatch repair and p53 in signaling induction of apoptosis by alkylating agents
Abstract
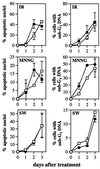
All cells are unavoidably exposed to chemicals that can alkylate DNA to form genotoxic damage. Among the various DNA lesions formed, O(6)-alkylguanine lesions can be highly cytotoxic, and we recently demonstrated that O(6)-methylguanine (O(6)MeG) and O(6)-chloroethylguanine (O(6)CEG) specifically initiate apoptosis in hamster cells. Here we show, in both hamster and human cells, that the MutSalpha branch of the DNA mismatch repair pathway (but not the MutSbeta branch) is absolutely required for signaling the initiation of apoptosis in response to O(6)MeGs and is partially required for signaling apoptosis in response to O(6)CEGs. Further, O(6)MeG lesions signal the stabilization of the p53 tumor suppressor, and such signaling is also MutSalpha-dependent. Despite this, MutSalpha-dependent apoptosis can be executed in a p53-independent manner. DNA mismatch repair status did not influence the response of cells to other inducers of p53 and apoptosis. Thus, it appears that mismatch repair status, rather than p53 status, is a strong indicator of the susceptibility of cells to alkylation-induced apoptosis. This experimental system will allow dissection of the signal transduction events that couple a specific type of DNA base lesion with the final outcome of apoptotic cell death.
Figures

Similar articles
-
Nuclear translocation of mismatch repair proteins MSH2 and MSH6 as a response of cells to alkylating agents.J Biol Chem. 2000 Nov 17;275(46):36256-62. doi: 10.1074/jbc.M005377200. J Biol Chem. 2000. PMID: 10954713
-
Apoptosis triggered by DNA damage O6-methylguanine in human lymphocytes requires DNA replication and is mediated by p53 and Fas/CD95/Apo-1.Oncogene. 2004 Jan 15;23(2):359-67. doi: 10.1038/sj.onc.1207080. Oncogene. 2004. PMID: 14724564
-
MGMT: key node in the battle against genotoxicity, carcinogenicity and apoptosis induced by alkylating agents.DNA Repair (Amst). 2007 Aug 1;6(8):1079-99. doi: 10.1016/j.dnarep.2007.03.008. Epub 2007 May 7. DNA Repair (Amst). 2007. PMID: 17485253 Review.
-
Apoptotic signaling in response to a single type of DNA lesion, O(6)-methylguanine.Mol Cell. 2004 Apr 9;14(1):105-16. doi: 10.1016/s1097-2765(04)00162-5. Mol Cell. 2004. PMID: 15068807
-
The role of mismatch repair in DNA damage-induced apoptosis.Oncol Res. 1999;11(9):393-400. Oncol Res. 1999. PMID: 10821533 Review.
Cited by
-
Targeting and processing of site-specific DNA interstrand crosslinks.Environ Mol Mutagen. 2010 Jul;51(6):527-39. doi: 10.1002/em.20557. Environ Mol Mutagen. 2010. PMID: 20196133 Free PMC article. Review.
-
Mechanisms of chemoresistance to alkylating agents in malignant glioma.Clin Cancer Res. 2008 May 15;14(10):2900-8. doi: 10.1158/1078-0432.CCR-07-1719. Clin Cancer Res. 2008. PMID: 18483356 Free PMC article. Review.
-
Mismatch repair protein expression and colorectal cancer in Hispanics from Puerto Rico.Fam Cancer. 2010 Jun;9(2):155-66. doi: 10.1007/s10689-009-9310-4. Fam Cancer. 2010. PMID: 20012372 Free PMC article.
-
Role of aldehydes in the toxic and mutagenic effects of nitrosamines.Chem Res Toxicol. 2013 Oct 21;26(10):1464-73. doi: 10.1021/tx400196j. Epub 2013 Sep 25. Chem Res Toxicol. 2013. PMID: 24066836 Free PMC article.
-
KRAS mutations in colorectal cancer from Tunisia: relationships with clinicopathologic variables and data on TP53 mutations and microsatellite instability.Mol Biol Rep. 2013 Nov;40(11):6107-12. doi: 10.1007/s11033-013-2722-0. Mol Biol Rep. 2013. PMID: 24078161
References
-
- Hollstein M, Sidransky D, Vogelstein B, Harris C C. Science. 1991;253:49–53. - PubMed
-
- Clarke A R, Purdie C A, Harrison D J, Morris R G, Bird C C, Hooper M L, Wyllie A H. Nature (London) 1993;362:849–852. - PubMed
-
- Sheikh M S, Burns T F, Huang Y, Wu G S, Amundson S, Brooks K S, Fornace A J, Jr, el-Deiry W S. Cancer Res. 1998;58:1593–1598. - PubMed
-
- Kastan M B, Onyekwere O, Sidransky D, Vogelstein B, Craig R W. Cancer Res. 1991;51:6304–6311. - PubMed
Publication types
MeSH terms
Substances
Grants and funding
LinkOut - more resources
Full Text Sources
Research Materials
Miscellaneous

