. 1999 Aug;10(8):2687-702.
doi: 10.1091/mbc.10.8.2687.

Clathrin assembly lymphoid myeloid leukemia (CALM) protein: localization in endocytic-coated pits, interactions with clathrin, and the impact of overexpression on clathrin-mediated traffic

Affiliations
Free PMC article

Clathrin assembly lymphoid myeloid leukemia (CALM) protein: localization in endocytic-coated pits, interactions with clathrin, and the impact of overexpression on clathrin-mediated traffic

F Tebar et al. Mol Biol Cell. 1999 Aug.
Free PMC article

Abstract

The clathrin assembly lymphoid myeloid leukemia (CALM) gene encodes a putative homologue of the clathrin assembly synaptic protein AP180. Hence the biochemical properties, the subcellular localization, and the role in endocytosis of a CALM protein were studied. In vitro binding and coimmunoprecipitation demonstrated that the clathrin heavy chain is the major binding partner of CALM. The bulk of cellular CALM was associated with the membrane fractions of the cell and localized to clathrin-coated areas of the plasma membrane. In the membrane fraction, CALM was present at near stoichiometric amounts relative to clathrin. To perform structure-function analysis of CALM, we engineered chimeric fusion proteins of CALM and its fragments with the green fluorescent protein (GFP). GFP-CALM was targeted to the plasma membrane-coated pits and also found colocalized with clathrin in the Golgi area. High levels of expression of GFP-CALM or its fragments with clathrin-binding activity inhibited the endocytosis of transferrin and epidermal growth factor receptors and altered the steady-state distribution of the mannose-6-phosphate receptor in the cell. In addition, GFP-CALM overexpression caused the loss of clathrin accumulation in the trans-Golgi network area, whereas the localization of the clathrin adaptor protein complex 1 in the trans-Golgi network remained unaffected. The ability of the GFP-tagged fragments of CALM to affect clathrin-mediated processes correlated with the targeting of the fragments to clathrin-coated areas and their clathrin-binding capacities. Clathrin-CALM interaction seems to be regulated by multiple contact interfaces. The C-terminal part of CALM binds clathrin heavy chain, although the full-length protein exhibited maximal ability for interaction. Altogether, the data suggest that CALM is an important component of coated pit internalization machinery, possibly involved in the regulation of clathrin recruitment to the membrane and/or the formation of the coated pit.


Figures

Figure 1
Figure 1
Western blotting detection and immunoprecipitation of CALM protein. (A) TX100 lysates of HeLa and COS-1 cells and of COS-1 cells transiently overexpressing CALM (COS-1 + rCALM) were resolved on 7.5% SDS-PAGE, and CALM was detected by blotting with Ab20. Molecular weight markers (m.w.m.) are indicated. (B) CALM protein was precipitated with Ab20 from TX100 lysates of HeLa cells, and the immunoprecipitates (IP) were analyzed by SDS-PAGE and Western blotting with Ab20 to CALM and antibody TD.1 to CHC. Nonspecific rabbit IgG (NRIgG) was used to control the specificity of immunoprecipitation. (C) The lysates of HeLa cells transfected with GFP fused to full-length CALM (GFP–CALM) were incubated with anti-GFP, Ab20, or nonspecific IgG, and the immunoprecipitates were analyzed by electrophoresis and Western blotting with TD.1 or Ab20 to detect CHC or endogenous CALM and GFP–CALM, respectively. The positions of endogenous 72- and 66-kDa species of CALM and CHC are indicated by arrows. Note, significant overexpression of GFP–CALM (99 kDa) is indicated by the large arrow. The asterisk marks the proteolytic product of GFP–CALM (∼74 kDa). A relatively high amount of the proteolytic product of GFP–CALM is found in immunoprecipitates, presumably, because of the proteolysis during the immunoprecipitation procedure.
Figure 2
Figure 2
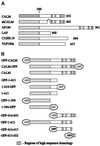
Schematic representation of CALM and homologous proteins. (A) Depicted are the full-length and the short-form human CALM (shCALM; 50 residues are deleted), rat AP180, Drosophila melanogaster LAP, Caenorhabditis elegans C32E8.10 (U88308), and yeast yAP180A. The approximate positions of the regions with the highest sequence similarity between proteins, corresponding to the CALM amino acid residues 1–300, 507–533, 539–553, 567–590, and 623–638, and the internal deletion of residues 420–469 (marked with ∧) because of the alternative splicing of human CALM are indicated. The number to the right of each lane represents the total number of residues. (B) The fragments of CALM expressed as GFP fusion proteins are shown. The first and the last CALM residues and the position of the GFP moiety are indicated for each construct. Fragments 1–413 and 414–652 as well as the full-length CALM were also expressed as GST fusion proteins.
Figure 3
Figure 3
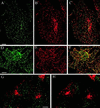
Localization of CALM in the cell. HeLa cells fixed with methanol (A–C) or methanol/acetone (D–H) were incubated with Ab20 and either X.22 (A–C), AP.6 (D–F), or 100/3 (G and H) monoclonal antibody followed by secondary anti-rabbit and anti-mouse IgG conjugated with fluorescein or CY3, respectively. The serial optical sections were acquired through the CY3 (red) and FITC (green) channels and deconvoluted as described in MATERIALS AND METHODS. The fluorescein and CY3 images representing individual optical sections (thickness of 0.2 μm) were merged (C, F, G, and H) after adjustment of both fluorescence signals to similar levels. The red images in C and F were shifted to the right by 3 pixels (0.2 μm), relative to green images to allow better visualization of the colocalization. Images in G and H represent two optical sections of the Z-stack that were acquired 3.6 μm apart. Bars: A–C, D–F, and G and H, 5 μm.
Figure 4
Figure 4
The quantitative analysis of CALM and CHC in cellular fractions. (A) The saponin (SAP) and TX100-soluble (TX-100) and -insoluble (pellet) fractions were obtained from HeLa cells as described in MATERIALS AND METHODS and resolved on SDS-PAGE. CHC, CALM, α-adaptin, and γ-adaptin were detected by Western blotting with antibodies TD.1, Ab20, AC.1, and 100/3, respectively. (B) HeLa cells grown on coverslips were permeabilized with saponin and TX100 as described in MATERIALS AND METHODS, fixed with methanol/acetone, and incubated with Ab20 and AP.6 followed by secondary anti-rabbit and anti-mouse IgG conjugated with fluorescein or CY3, respectively. The serial optical sections were acquired through the CY3 (red) and FITC (green) channels and deconvoluted. The fluorescein (CALM) and CY3 (AP-2) images representing individual optical sections (thickness of 0.2 μm) were merged, and the red image was shifted to the right by 3 pixels (0.2 μm) relative to the green image to allow better visualization of the colocalization. Inset (bottom right), high magnification of a group of coated pits (area indicated by white rectangular box) is shown; the arrow indicates the direction of the shift. The position of the nucleus is indicated (n). Bar, 5 μm. (C) Various amounts of CALM–1–413 and GST–TD were electrophoresed and blotted with, correspondingly, Ab20 and TD.1 simultaneously with the blotting of CALM and clathrin in cellular fractions obtained as described in A. Exemplary curves of the dependence of the chemiluminescence signals on the amount of proteins are presented. Typically, the intensity of these signals measured by densitometry (see MATERIALS AND METHODS) displayed linear dependence within the range of 1–5 pmol of the proteins. Arbitrary units (a.u.) represent the optical density units. (D) Various aliquots of HeLa cellular fractions were immunoblotted as described in A, and the chemiluminescence signals that fit within the linear range of the detection in the same experiments were used to calculate the mole/mole ratio of CALM and CHC. The data are averaged from four experiments similar to that presented in A. Error bars represent SDs.
Figure 5
Figure 5
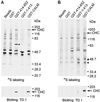
Binding of clathrin heavy chain to GST–CALM. GST–CALM, GST–1–413, and GST–414–652 were bound to glutathione-agarose beads and incubated with the cytosolic (saponin extract; A) or membrane (TX100 and deoxycholate extract; B) fractions of 35S-metabolically labeled HeLa cells. Beads alone or with immobilized GST were used to control for the nonspecific binding of proteins. The agarose precipitates were resolved via 7.5% SDS-PAGE and transferred to a nitrocellulose membrane. Top, autoradiographs of the membranes are presented. The position of a 175-kDa–labeled band specifically associated with GST–CALM and GST–414–652 is indicated by arrows. Bottom, the same membranes were probed by Western blotting with antibody TD.1 to CHC. The detected band precisely overlapped with the 180-kDa radioactive band. The blots are from the same experiment. Asterisks mark other unidentified bands specifically bound to the fusion proteins.
Figure 6
Figure 6
The localization of GFP–CALM in living and fixed cells. COS-1 cells were transiently transfected with GFP–CALM (FL; A–D), GFP–414–652 (CT; E–H), or GFP–1–413 (NT; I–L). (A, E, and I) For living-cell microscopy, cells were grown in microscope chambers, and the images were acquired through the GFP channel as described in MATERIALS AND METHODS. (B–D, F–H, and J–L) Cells grown on coverslips were fixed and stained with antibody X.22 to CHC followed by secondary IgGs labeled with Texas Red. The serial optical sections were acquired through the Texas Red (red) and GFP (green) channels and deconvoluted as described in MATERIALS AND METHODS. The fluorescein (green) and Texas Red (red) channels were merged (D, H, and L) after adjustment of both fluorescence signals to similar levels. Yellow indicates the overlap of Texas Red and fluorescein fluorescence. All images comprise an individual optical section. Insets, the peripheral regions of the cells indicated by white square boxes are shown at higher magnification and with enhanced contrast. Bar, 5 μm.
Figure 7
Figure 7
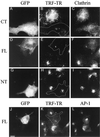
The effect of GFP–CALM overexpression on transferrin endocytosis and clathrin distribution. COS-1 cells expressing GFP–414–652 (CT; A–C), GFP–CALM (FL; D–F and J–L), or GFP–1–413 (NT; G–I) were incubated with 5 μg/ml TRF–TR for 15 min at 37°C, fixed, and stained with antibodies X.22 to CHC (A–I) or 100/3 to γ-adaptin (J–L) followed by secondary IgGs labeled with AMCA. The serial optical sections were acquired through the Texas Red (red), GFP (green), and AMCA/DAPI (blue) channels and deconvoluted as described in MATERIALS AND METHODS. All images represent the merged images of 20 serial optical sections (total thickness of 4 μm). The approximate perimeter of GFP-expressing cells is indicated in the images of TRF–TR endocytosis by the dashed lines (B, E, H, and K). Bar, 5 μm.
Figure 8
Figure 8
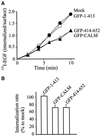
Internalization of 125I-labeled EGF in GFP–CALM–expressing cells. (A) COS-1 cells transfected with GFP (mock; ○), GFP–CALM (▴), GFP–414–652 (▵), or GFP–1–413 (●) were incubated with 2.0 ng/ml 125I-labeled EGF for 1–10 min, and the amount of surface-bound and internalized radioactivity was determined as described in MATERIALS AND METHODS. The rate of internalization is expressed as the ratio of internalized and surface 125I-labeled EGF for each time point. (B) Internalization rates are averaged from four experiments performed as described in A. The rates are expressed as the percent of internalization rates in mock-transfected cells.
Figure 9
Figure 9
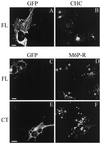
The effect of GFP–CALM expression on the localization of clathrin and M6P receptor. COS-1 cells expressing GFP–CALM (FL; A–D) or GFP–414–652 (CT; E and F) grown on coverslips were fixed and stained with mouse monoclonal anti-clathrin X.22 (A and B) and rabbit polyclonal anti-M6P receptor (C–F) followed by the secondary goat IgGs specific to mouse or rabbit IgG, respectively, labeled with Texas Red. The serial optical sections were acquired through the Texas Red (red) and GFP (green) channels and deconvoluted as described in MATERIALS AND METHODS. Images represent the merged images of two serial optical sections (total thickness of 0.4 μm) from the middle of the cell, where the most intense signal for CHC or M6P receptor (M6P-R) in the perinuclear area was observed. Asterisks show the position of cell nuclei. Bars: A and B, C and D, and E and F, 10 μm.
Figure 10
Figure 10
Coimmunoprecipitation of CHC with CALM and its fragments. (A) The lysates of COS-1 cells transfected with GFP–CALM were incubated with anti-GFP, X.22, or nonspecific mouse IgG (mIgG), and the immunoprecipitates were resolved by SDS-PAGE. CHC and GFP–CALM were detected by blotting with TD.1 or anti-GFP, respectively. (B) GFP–CALM, GFP–414–652, GFP–1–413, GFP–1–304, GFP–1–613, GFP–414–613, and GFP–613–652 fragments (see Figure 2) were immunoprecipitated with anti-GFP from the TX100 lysates of transiently transfected COS-1 cells. The immunoprecipitates were analyzed by SDS-PAGE, and the presence of CHC and GFP fusion proteins in the immunoprecipitates was detected by blotting with antibodies TD.1 or anti-GFP, respectively. Arrows indicate the positions of the GFP fusion proteins, whereas the arrowheads point to the position of CHC. The lanes in each panel (labeled Exp1, Exp2, and Exp3) are from the same experiment. The data in each panel are representative of several independent experiments.

Similar articles

Cited by

References

    1. Ahle S, Ungewickell E. Purification and properties of a new clathrin assembly protein. EMBO J. 1986;5:3143–3149. - PMC - PubMed
    1. Brodsky FM. Clathrin structure characterized with monoclonal antibodies. I. Analysis of multiple antigenic sites. J Cell Biol. 1985;101:2047–2054. - PMC - PubMed
    1. Carpenter G, Cohen S. 125I-Labeled human epidermal growth factor: binding internalization, and degradation in human fibroblasts. J Cell Biol. 1976;71:159–171. - PMC - PubMed
    1. Chen H, Fre S, Slepnev VI, Capua MR, Takei K, Butler MH, Di Fiore PP, De Camilli P. Epsin is an EH-domain-binding protein implicated in clathrin-mediated endocytosis. Nature. 1998;394:793–797. - PubMed
    1. De Beer T, Carter RE, Lobel-Rice KE, Sorkin A, Overduin M. Structure and Asn-Pro-Phe binding pocket of the eps15 homology domain. Science. 1998;281:1357–1360. - PubMed

Publication types

MeSH terms