. 1999 Jul 15;13(14):1847-60.
doi: 10.1101/gad.13.14.1847.

A GATA-2/estrogen receptor chimera functions as a ligand-dependent negative regulator of self-renewal

Affiliations

A GATA-2/estrogen receptor chimera functions as a ligand-dependent negative regulator of self-renewal

C Heyworth et al. Genes Dev. .

Abstract

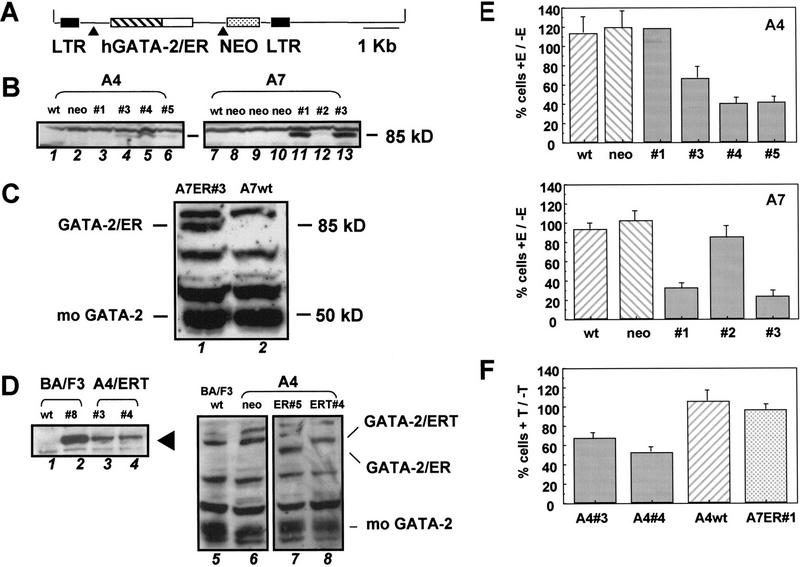
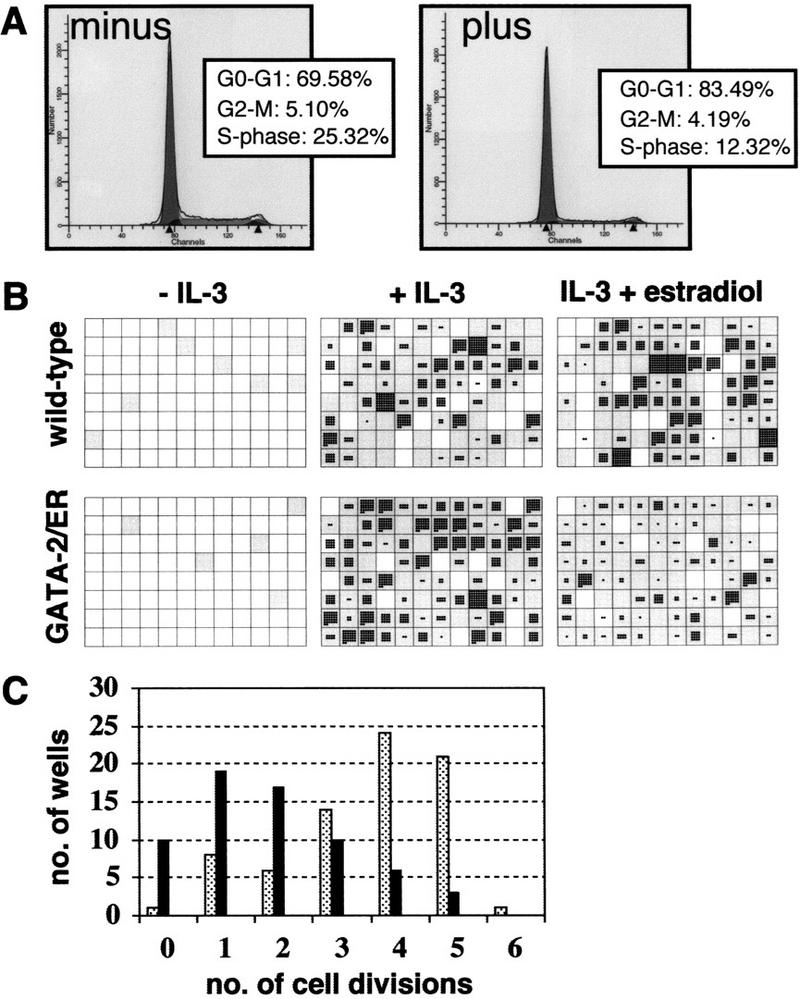
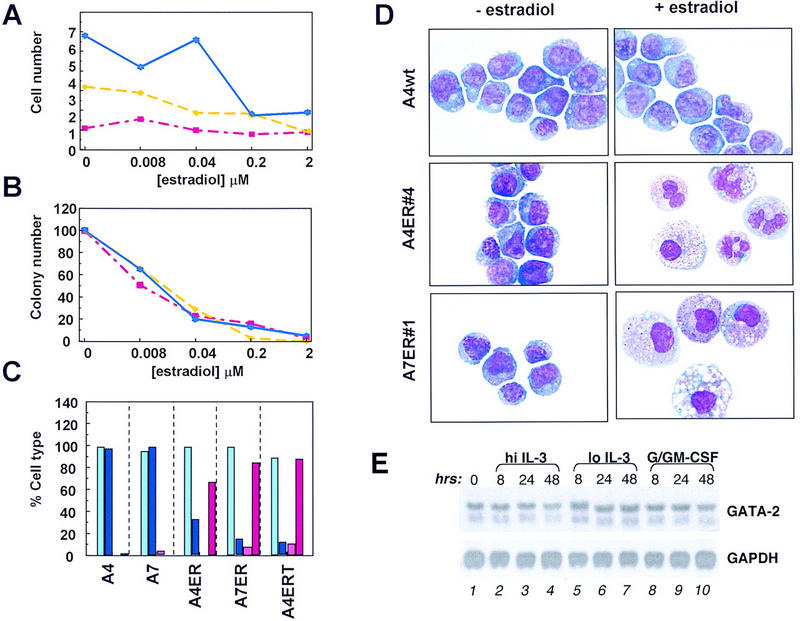
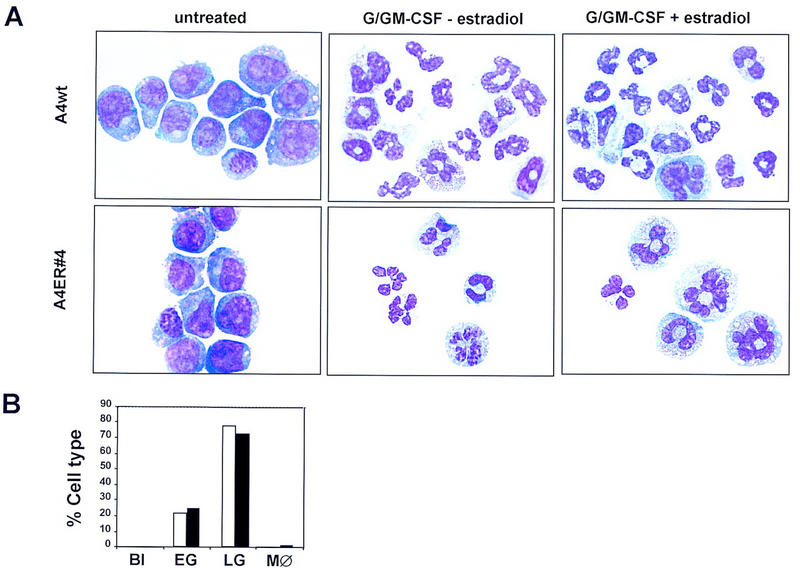
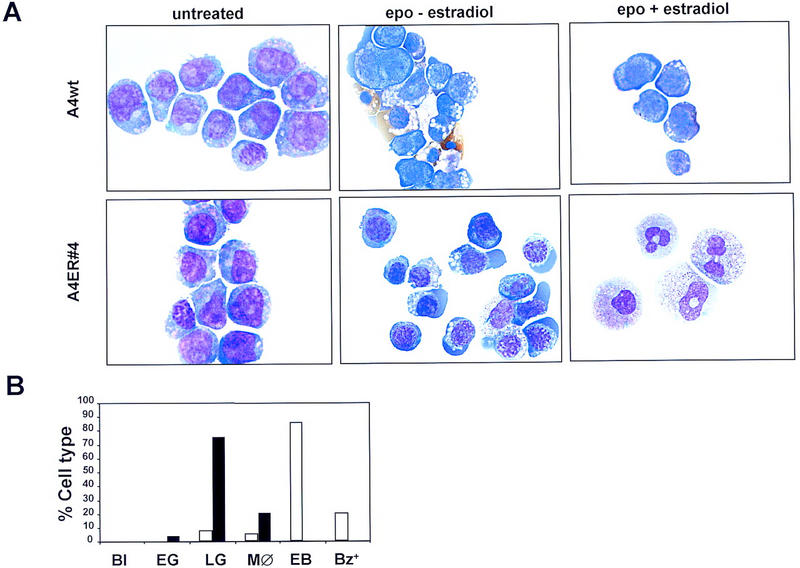
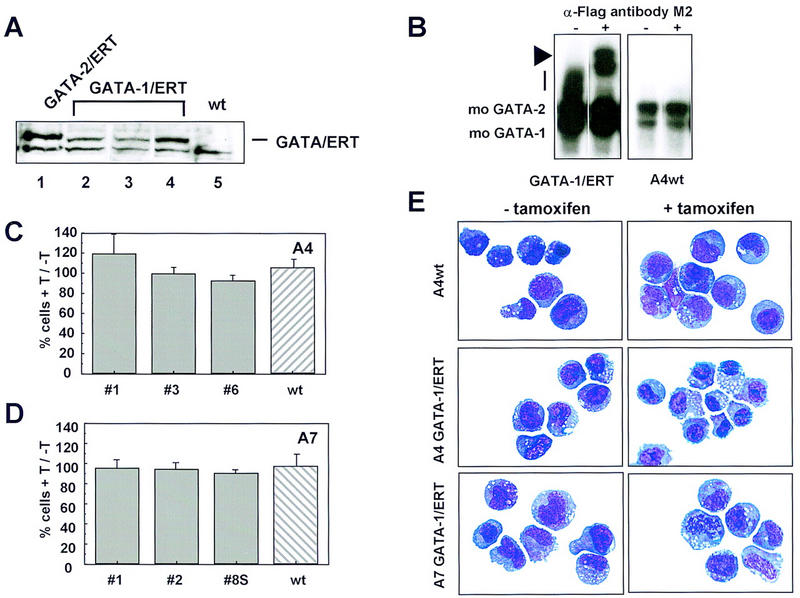
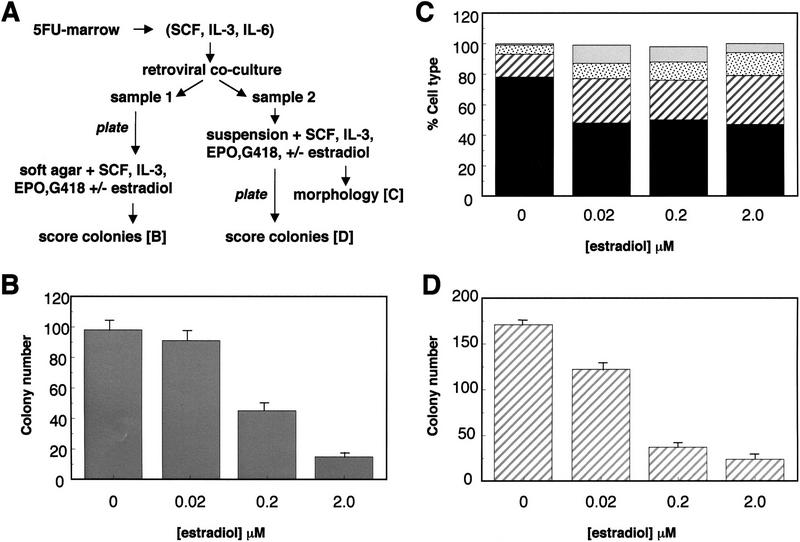
The transcription factor GATA-2 is expressed in hematopoietic stem and progenitor cells and is functionally implicated in their survival and proliferation. We have used estrogen and tamoxifen-inducible forms of GATA-2 to modulate the levels of GATA-2 in the IL-3-dependent multipotential hematopoietic progenitor cell model FDCP mix. Ligand-dependent induction of exogenous GATA-2 activity did not rescue cells deprived of IL-3 from apoptosis. However, induction of GATA-2 activity in cells cultured in IL-3 blocked factor-dependent self-renewal but not factor-dependent survival: Cells undergo cell cycle arrest and cease proliferating but do not apoptose. This was accompanied by differentiation down the monocytic and granulocytic pathways. Differentiation occurred in the presence of IL-3 and did not require addition of exogenous differentiation growth factors such as G-CSF or GM-CSF normally required to induce granulomonocytic differentiation of FDCP-mix cells. Conversely, EPO-dependent erythroid differentiation was inhibited by GATA-2 activation. These biological effects were obtained with levels of exogenous GATA-2 representing less than twofold increases over endogenous GATA-2 levels and were not observed in cells overexpressing GATA-1/ER. Similar effects on proliferation and differentiation were also observed in primary progenitor cells, freshly isolated from murine bone marrow and transduced with a GATA-2/ER-containing retrovirus. Taken together, these data suggest that threshold activities of GATA-2 in hematopoietic progenitor cells are a critical determinant in influencing self-renewal versus differentiation outcomes.


Figures

Figure 1
Figure 1
Forced expression of GATA-2 in murine FDCP-mix cells. (A) Retroviral construct used for infection of hematopoietic cells. The GATA-2/ER fusion (see Materials and Methods) was transferred into the MESV-based retroviral vector p50-M-X-neo. Expression of both GATA-2/ER and the neo selectable marker is under the control of the viral LTR and achieved through alternative splicing of the viral mRNA (▴). A similar p50-M-X-neo construct containing a Flag epitope-tagged GATA-2/ERT fusion was also prepared (not shown). (B) Clones of FDCP-mix A4 (left) and FDCP-mix A7 (right) successfully infected and expressing the 85-kD GATA-2/ER protein were identified by Western blotting using an anti-GATA-2 antibody. (Left) (Lane 1) Wild-type FDCP-mix A4; (lane 2) vector-alone infected control cells; (lanes 3–6) GATA-2/ER infected clones 1, 3, 4, and 5. (Right) (Lane 7) Wild-type FDCP-mix A7; (lanes 8–10) vector-alone infected control cells; (lanes 11–13) GATA-2/ER-infected clones 1, 2, and 3. (C) The level of GATA-2/ER protein in FDCP-mix A7 relative to endogenous mouse GATA-2 was determined by Western blotting using an anti-GATA-2 polyclonal antibody which recognizes both human and mouse GATA-2. (Lane 1) A7 GATA-2/ER no. 3; (lane 2) wild-type FDCP-mix A7 cells. (D) Analysis of FDCP-mix GATA-2/ERT clones. (Left) Clones expressing the Flag-tagged GATA-2/ERT protein (arrowhead) were identified using the M2 anti-Flag antibody. (Lane 1) Wild-type BA/F3; (lane 2) BA/F3 GATA-2/ERT clone 8b (positive control); (lanes 3,4) FDCP-mix A4 clones 3 and 4 expressing GATA-2/ERT. (Right) The level of GATA-2/ERT protein in the FDCP-mix A4 GATA-2/ERT clones relative to endogenous mouse GATA-2 and to GATA-2/ER in the highest expressing clone was determined by Western blot using the anti-GATA-2 antibody that recognizes all three proteins. (Lane 5) BA/F3 (negative control); (lane 6) FDCP-mix A4 neo (negtive control); (lane 7) FDCP-mix A4 GATA-2/ER clone 5; (lane 8) FDCP-mix A4 GATA-2/ERT clone 4. The GATA-2/ER, GATA-2/ERT, and endogenous mouse GATA-2 bands are indicated. (E) Inhibition of cell growth of FDCP-mix A4 GATA-2/ER (top) and FDCP-mix A7 GATA-2/ER (bottom) clones. A4wt cells are wild-type FDCP-mix A4 cells, whereas A4neo are vector-alone infected FDCP-mix A4 cells. A4 no. 1, A4 no. 3, A4 no. 4, and A4 no. 5 are the GATA-2/ER clones shown in B (left). A7wt cells are wild-type FDCP-mix A7 cells; A7neo are vector-alone infected cells; and A7 no. 1, A7 no. 2, and A7 no. 3 are the GATA-2/ER clones shown in B (right). In these and all subsequent experiments we observed no significant differences between wild-type and vector-alone infected cells. Cells were seeded at 8 × 104/ml in IL-3-containing medium and in the presence or absence of 2μm β-estradiol. After 3 days of growth at 37°C, the cells were harvested and counted after trypan blue staining. The number of cells obtained in the presence of β-estradiol (+E) is expressed as a percentage of that in the absence of β-estradiol (−E). The results are the average of at least three experiments ±s.e.m., except for A4 no. 1, which was only assayed once. (F) Inhibition of cell growth of GATA-2/ERT-expressing clones. Cells were seeded at 8 × 104/ml in IL-3-containing medium and in the presence or absence of 2μm tamoxifen. After 3 days of growth at 37°C, the cells were harvested and counted after trypan blue staining. The number of cells obtained in the presence of tamoxifen (+T) is expressed as a percentage of the number in the absence of tamoxifen (−T). The results are the average of three experiments ±s.e.m..
Figure 2
Figure 2
Analysis of GATA-2-mediated growth arrest. (A) cell cycle analysis of GATA-2/ER cells. GATA-2/ER cells exponentially growing in IL-3-containing medium were incubated minus (left) or plus (right) 0.2 μm β-estradiol for 48 hr. The cells were harvested and stained with Hoechst dye, and cell cycle distribution analyzed on a Becton-Dickinson FACS Vantage flow cytometer using MODFIT LT v. 2.0 software (Verity Software, USA). The plot shows a typical result obtained with A7 GATA-2/ER no. 1. Similar results were obtained with other clones, and each experiment was performed at least three times. (B) A7 GATA-2/ER no. 1 cells were seeded into 96-well plates in the absence of IL-3 or in IL-3 (10 ng/ml) with or without 0.2 μm β-estradiol. The number of cells was counted at 24 hr and 3 days. For each experiment two trays per condition were assessed, and the experiment repeated three times. A typical set of plates is shown. Wells that contained a viable cell at 24 hr are shown in gray. The number of cells in each well after 3 days growth is shown, with each cell represented by a single black dot. (C) Summary of the number of GATA-2/ER cell divisions that had occurred in each well in the presence of IL-3 but absence (stippled bars) or presence (solid bars) of β-estradiol. The results represent a count of the number of wells from one experiment but are typical of three independent experiments.
Figure 3
Figure 3
Enforced GATA-2 expression leads to differentiation. (A) A7 GATA-2/ER no. 1 cells were seeded at 8 × 104 cells/ml in IL-3-containing medium in the presence of various concentrations of β-estradiol. Cells were harvested after incubation at 37°C for 1, 2, or 3 days. The number of viable cells was determined by trypan blue staining and plotted against the concentration of β-estradiol used. The experiment was performed three times, and the plot shows the results from a typical experiment. Day 1, 2, and 3 samples are plotted in red, yellow and blue, respectively. (B) A7 GATA-2/ER no. 1 cells were treated for 1, 2, or 3 days with β-estradiol as described above. After harvesting the cells, washing twice with PBS, 2 × 103 cells/ml were plated in IL-3-stimulated soft agar CFC assays. Plates were incubated at 37°C for 7 days, and the number of colonies counted and expressed as a percentage of the untreated control. The experiments were performed in parallel to those in A, and the plot shows the results from a typical experiment. Day 1, 2, and 3 samples are plotted in red, yellow, and blue, respectively. (C) Wild-type FDCP-mix A4 and A7 cells and clones of A4 and A7 expressing GATA-2/ER or GATA-2/ERT were grown in IL-3-containing medium for 3 days in the absence or presence of the appropriate inducer (0.2 μm β-estradiol or 2 μm tamoxifen). The cells were harvested, cytospun, and stained. The morphology was determined as either blast cells or granulocyte/macrophage cells, and the results expressed graphically as a percentage of the total. Light blue, blasts (− estradiol); dark blue, blasts (+ estradiol); pink, granulocytes/macrophages (− estradiol); red, granulocytes/macrophages (+ estradiol). (D) Wild-type and GATA-2/ER-expressing FDCP-mix clones were treated as described for C. In the absence of β-estradiol (− estradiol) all of the cells had a primitive morphology characteristic of blast cells. Incubation of control cells (A4wt) in the presence of β-estradiol (+ estradiol) did not change their morphology. However, clones containing inducible GATA-2 differentiated and showed up-regulation of the myeloid surface markers Mac-1 and GR-2 (not shown). The morphologies observed were characteristic of either granulocyte/monocyte (A4 GATA-2/ER no. 4) or monocytes (A7 GATA-2/ER no. 1). Granulocytes have a condensed segmented nucleus with a pale staining cytoplasm containing some granules, whereas monocytes are larger cells with a large cytoplasmic/nuclear ratio and a slightly kidney-shaped nucleus. The morphology of these cells is typical of mature murine hematopoietic cells differentiated in vitro. Typically, some vacuolation of both immature and mature cells may be seen in these in vitro culture conditions. (E) The level of GATA-2 mRNA in wild-type FDCP-mix cells during granulomonocytic differentiation was assessed by Northern blot using a portion of the murine GATA-2 cDNA as a probe. FDCP-mix cells were cultured for the time periods indicated (0, 8, 24, 48 hr) under normal self-renewal conditions (hi IL-3, lanes 2–4), the low IL-3 condition normally used during the G/GM-CSF culture (lo IL-3, lanes 5–7), or granulomonocytic differentiation conditions (G/GM-CSF, lanes 8–10). The GATA-2 mRNA is detected as two bands of 3.5 and 2.9 kb. Equal RNA loading in each lane was confirmed by stripping the membrane and reprobing for GAPDH mRNA (1.2 kb).
Figure 4
Figure 4
Added granulocyte/monocyte differentiation factors do not alter GATA-2-mediated differentiation programs. (A) FDCP-mix clones were differentiated in the presence of exogenous G/GM-CSF [provided by 15% (vol/vol) lung-conditioned medium] and low IL-3 (0.01 ng/ml). The morphology of differentiated cells was determined (see above), and early and late granulocytes were scored separately. Promyeloctes and myelocytes were scored as early granulocytes while metamyelocytes and more mature granulocytes were scored as late granulocytes. As cells mature from blasts to early granulocytes, the cytoplasmic/nuclear ratio becomes larger while the cytoplasm becomes less basophilic and granules begin to appear within it. Progressive maturation to late granulocytes is characterized by a further reduction in the size of the cell, a marked condensation of the chromatin, and a segmented nucleus. The fully mature granulocyte has a very lightly stained cytoplasm with no granules present. (Top) Typical photomicrographs of wild-type FDCP-mix A4 cells, either untreated or differentiated in the presence of G/GM-CSF but the absence of β-estradiol, or differentiated in the presence of G/GM-CSF and β-estradiol. (Bottom) The morphology of the A4 GATA-2/ER no. 4 cells cultured under the same conditions. (B) Summary of the number of each cell type expressed as a percentage of the total cell number for A4 GATA-2/ER no. 4 cells in the absence (open bars) and presence (solid bars) of β-estradiol. (Bl) Blasts; (EG) early granulocytes; (LG) late granulocytes; (MØ) monocytes.
Figure 5
Figure 5
Erythroid potential of wild-type and GATA-2/ER FDCP-mix cells. (A) FDCP-mix clones were differentiated in the presence of EPO (5 U/ml), hemin (0.2 mm), and low IL-3 (0.05 ng/ml). The morphology of differentiated cells is described in the legend to Fig. 3D; erythroid cells are characterized by their size being smaller than blast cells, a basophilic cytoplasm, and nuclei containing condensed chromatin. (Top) Typical photomicrographs of wild-type FDCP-mix A4 cells, either untreated (no EPO or β-estradiol), differentiated in the presence of erythroid differentiation factors (epo) but the absence of β-estradiol, or differentiated in the presence of epo and β-estradiol. (Bottom) The morphology of the A4 GATA-2/ER no. 4 cells cultured under the same conditions. (B) Summary of the number of each cell type expressed as a percentage of the total cell number for A4 GATA-2/ER no. 4 cells in the presence of EPO and absence (open bars) or presence (solid bars) of β-estradiol. (Bl) Blasts; (EG) early granulocytes; (LG) late granulocytes; (MØ) monocytes; (EB) erythroblasts; (Bz+) benzidine-positive cells.
Figure 6
Figure 6
Enforced expression of GATA-1/ERT in FDCP-mix A4 and A7 cells. (A) FDCP-mix clones expressing GATA-1/ERT (lanes 2-4) were identified by Western blotting using the M2 anti-Flag antibody. Comparison with a high expressing BA/F3 GATA-2/ERT clone (lane 1) shows that the expression levels obtained for GATA-1/ERT and GATA-2/ERT are similar. Untransfected FDCP-mix A4 (wt) was included (lane 5) as a control for the specificity of the antibody. (B) The expression level and DNA-binding activity of GATA-1/ ERT was assessed by EMSA as for GATA-2/ERT. The GATA-1/ERT protein DNA complex migrates as a smear (vertical bar), which is clearly absent from wild-type FDCP-mix A4 nuclear extract. Its identity was confirmed by using the M2 anti-Flag antibody (+ lanes) to supershift the complex (arrowhead). (C) The growth of wild-type (hatched bar) and three GATA-1/ERT-expressing (shaded bars) FDCP-mix A4 clones (nos. 1, 2, and 3) in the presence of 2 μm tamoxifen (T) is shown expressed as a percentage of their growth in the absence of tamoxifen. The results are the average of three experiments ±s.e.m.. (D) The experiment described in C was repeated for wild-type FDCP-mix A7 (hatched bar) and three GATA-1/ERT-expressing (shaded bars) FDCP-mix A7 clones. The results are essentially identical to those obtained in FDCP-mix A4 and are the average of three experiments ±s.e.m.. (E) Morphological analysis of cells expressing GATA-1/ERT. Cells were cultured in the absence (− tamoxifen) or presence (+ tamoxifen) of 2 μm tamoxifen for 3 days, harvested, cytospun, and stained. The cells used were A4 GATA-1/ERT clone 3, A7 GATA-1/ERT clone 2, and wild-type FDCP-mix A4. All cells have an essentially blast-like morphology both in the absence and presence of tamoxifen.
Figure 7
Figure 7
Enforced expression of GATA-2/ER in primary 5-FU bone marrow cells. (A) Scheme for the infection and assay of the effect of GATA-2/ER-expression in 5-FU bone marrow. (B) After retroviral infection, sample 1 was plated into soft agar assays in the presence of various doses of β-estradiol, growth factors, and G418. The results show the number of colonies at day 8 per 105 cells plated and are the average of triplicate plates. The error bars represent the s.d.. These results are representative of three similar experiments. (C) After 3 days in suspension culture, the cells from sample 2 were harvested and the morphology of the cells determined as described previously. The nested bar charts represent the numbers of different cell types: blasts (solid black), early granulocytes (hatched stripes), late granulocytes (stippled), and monocytes (shaded) seen at various β-estradiol concentrations and expressed as a percentage of the total cell number. (D) After 3 days in suspension culture, an aliquot of each well (1/33)/ml was plated in soft agar assay to determine the colony-forming potential of the cells. The number of colonies per plate is shown and is the average of triplicate plates, the error bars representing s.d.. These results are representative of two similar experiments.

Similar articles

Cited by

References

    1. Andrews AC, Faller DF. A rapid micropreparation technique for extraction of DNA-binding proteins from limiting numbers of mammalian cells. Nucleic Acids Res. 1991;19:2499. - PMC - PubMed
    1. Blobel GA, Sieff CA, Orkin SH. Ligand-dependent repression of the erythroid transcription factor GATA- 1 by the estrogen receptor. Mol Cell Biol. 1995;15:3147–3153. - PMC - PubMed
    1. Briegel K, Lim KC, Plank C, Beug H, Engel JD, Zenke M. Ectopic expression of a conditional GATA-2/estrogen receptor chimera arrests erythroid differentiation in a hormone-dependent manner. Genes & Dev. 1993;7:1097–1109. - PubMed
    1. Briegel K, Bartunek P, Stengl G, Lim KC, Beug H, Engel JD, Zenke M. Regulation and function of transcription factor GATA-1 during red blood cell differentiation. Development. 1996;122:3839–3750. - PubMed
    1. Chinnasamy N, Rafferty JA, Hickson I, Lashford LS, Longhurst SJ, Thatcher N, Margison GP, Dexter TM, Fairbairn LJ. Chemoprotective gene transfer II: Multilineage in vivo protection of haemopoiesis against the effects of an antitumour agent by expression of a mutant human O6-alkylguanine-DNA alkyltransferase. Gene Ther. 1998;5:842–847. - PubMed

Publication types

MeSH terms