. 1999 Jul;114(1):93-124.
doi: 10.1085/jgp.114.1.93.

Gating kinetics of single large-conductance Ca2+-activated K+ channels in high Ca2+ suggest a two-tiered allosteric gating mechanism

Affiliations

Gating kinetics of single large-conductance Ca2+-activated K+ channels in high Ca2+ suggest a two-tiered allosteric gating mechanism

B S Rothberg et al. J Gen Physiol. 1999 Jul.

Erratum in

  • J Gen Physiol 1999 Aug;114(2):337

Abstract

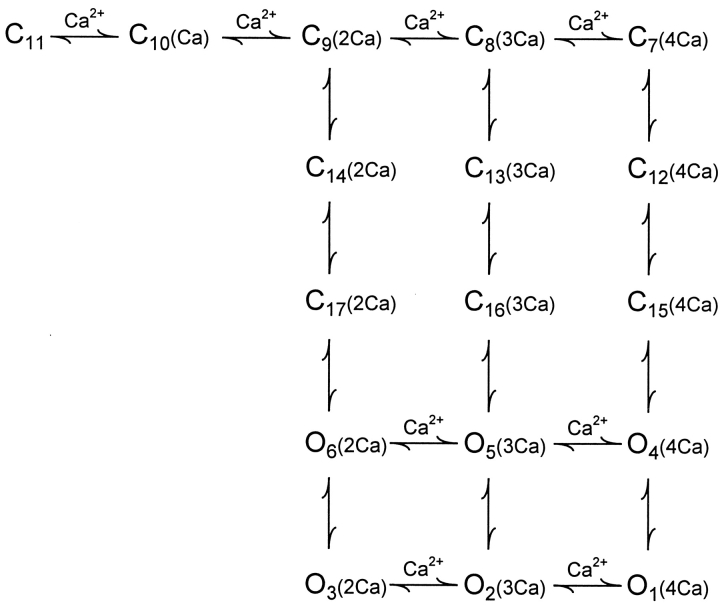
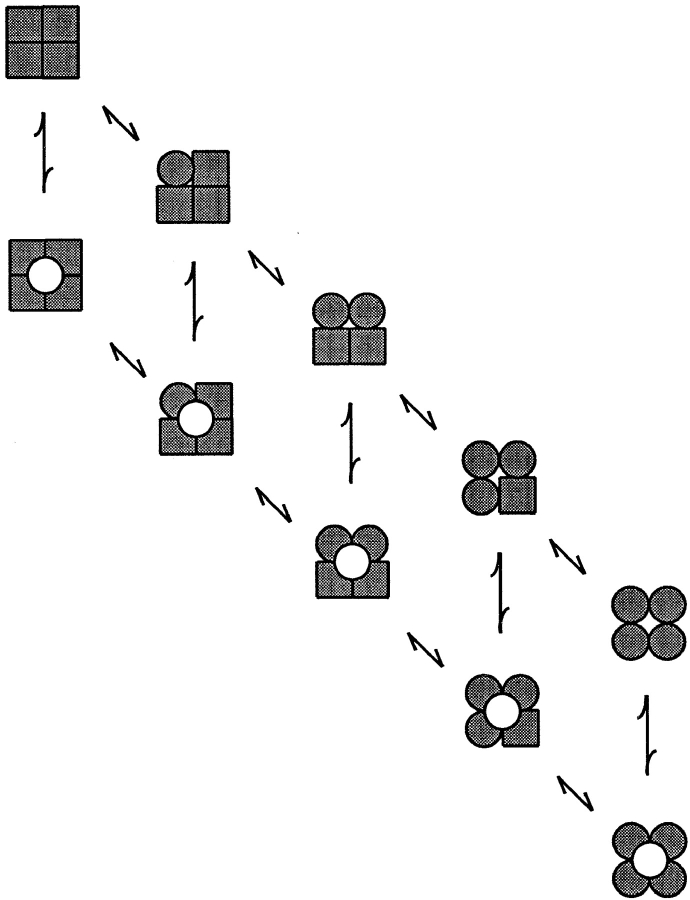
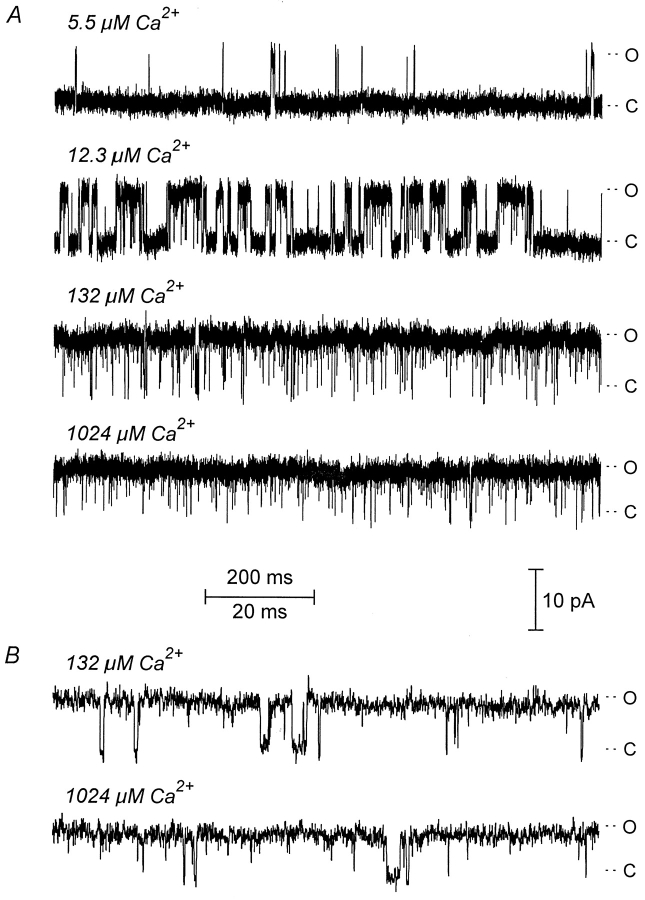
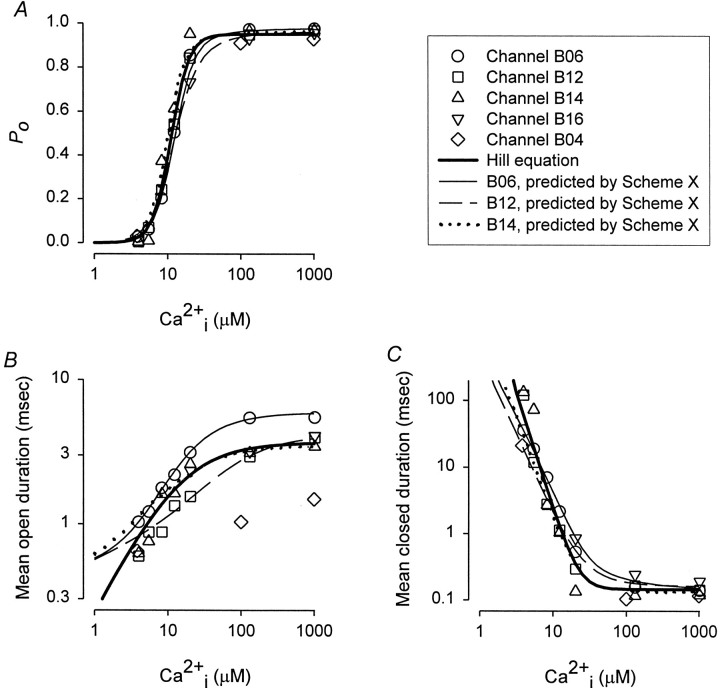
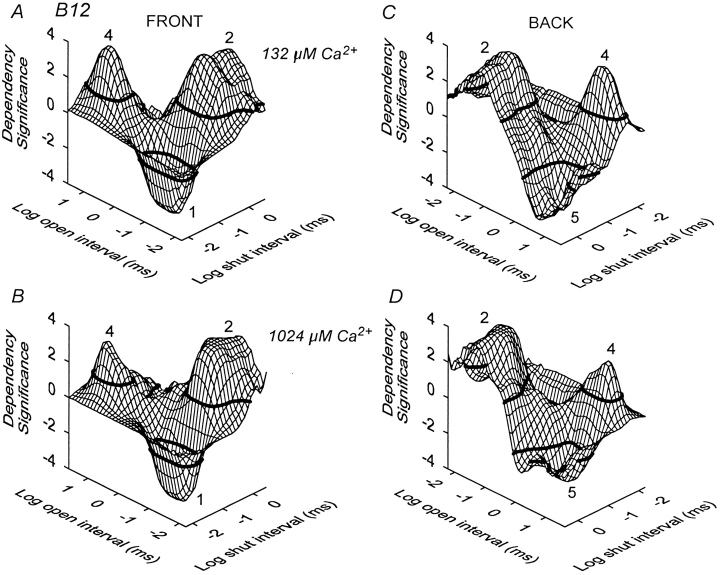
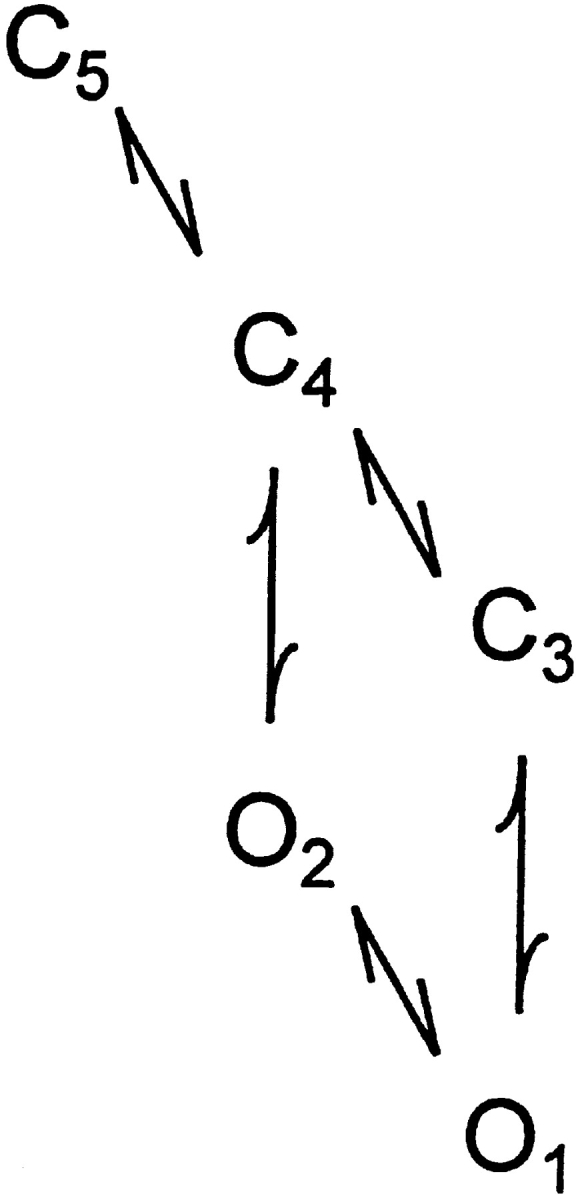
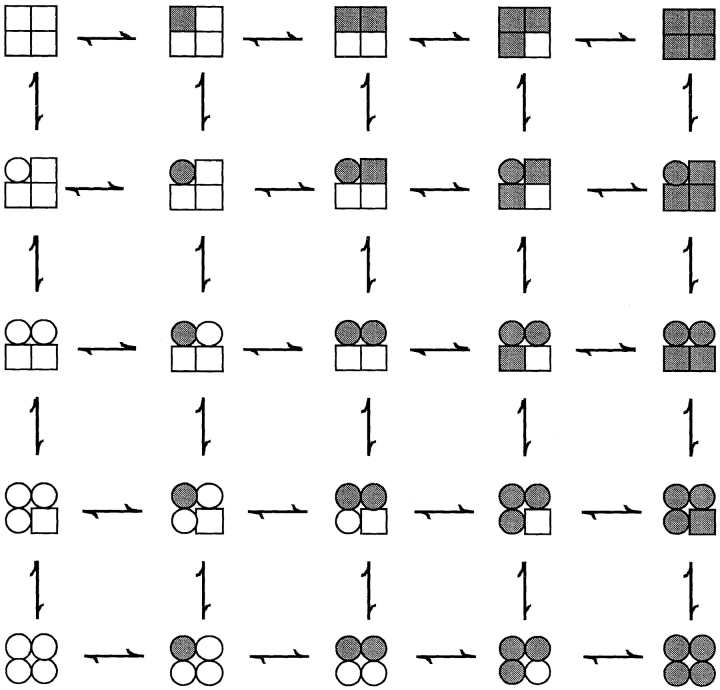
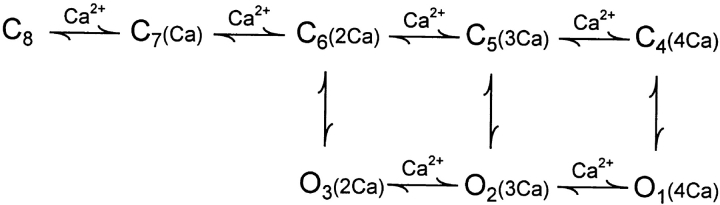
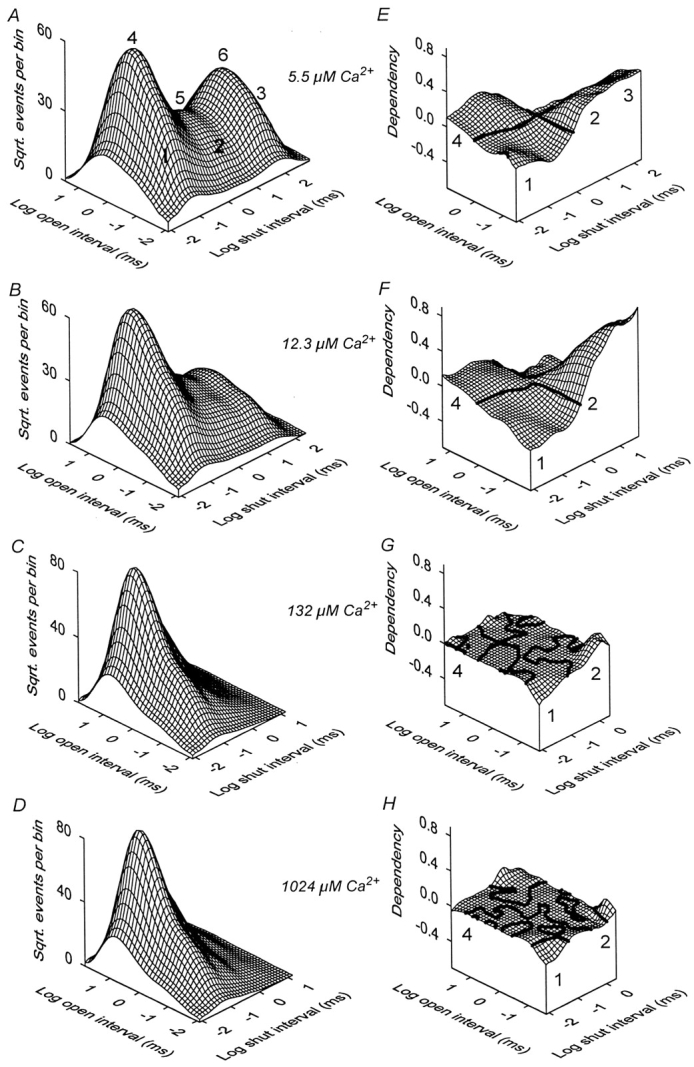
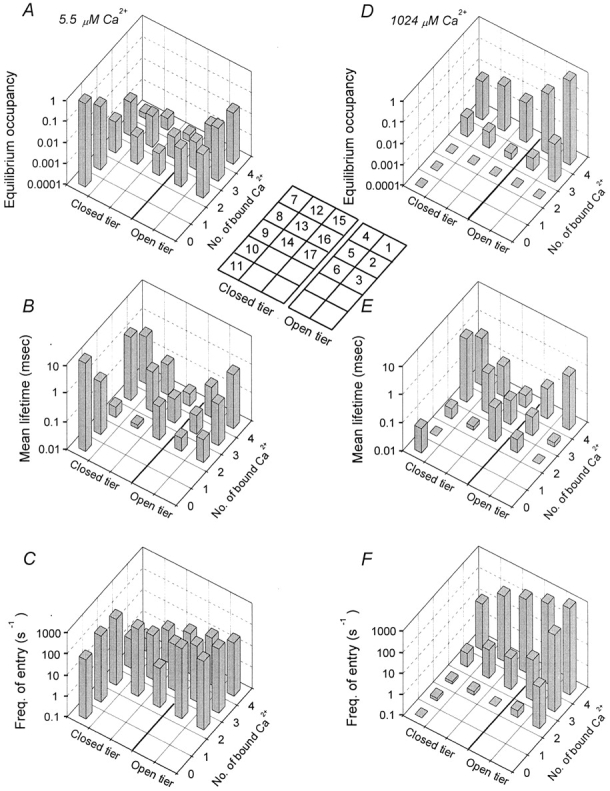
The Ca2+-dependent gating mechanism of large-conductance calcium-activated K+ (BK) channels from cultured rat skeletal muscle was examined from low (4 microM) to high (1,024 microM) intracellular concentrations of calcium (Ca2+i) using single-channel recording. Open probability (Po) increased with increasing Ca2+i (K0. 5 11.2 +/- 0.3 microM at +30 mV, Hill coefficient of 3.5 +/- 0.3), reaching a maximum of approximately 0.97 for Ca2+i approximately 100 microM. Increasing Ca2+i further to 1,024 microM had little additional effect on either Po or the single-channel kinetics. The channels gated among at least three to four open and four to five closed states at high levels of Ca2+i (>100 microM), compared with three to four open and five to seven closed states at lower Ca2+i. The ability of kinetic schemes to account for the single-channel kinetics was examined with simultaneous maximum likelihood fitting of two-dimensional (2-D) dwell-time distributions obtained from low to high Ca2+i. Kinetic schemes drawn from the 10-state Monod-Wyman-Changeux model could not describe the dwell-time distributions from low to high Ca2+i. Kinetic schemes drawn from Eigen's general model for a ligand-activated tetrameric protein could approximate the dwell-time distributions but not the dependency (correlations) between adjacent intervals at high Ca2+i. However, models drawn from a general 50 state two-tiered scheme, in which there were 25 closed states on the upper tier and 25 open states on the lower tier, could approximate both the dwell-time distributions and the dependency from low to high Ca2+i. In the two-tiered model, the BK channel can open directly from each closed state, and a minimum of five open and five closed states are available for gating at any given Ca2+i. A model that assumed that the apparent Ca2+-binding steps can reach a maximum rate at high Ca2+i could also approximate the gating from low to high Ca2+i. The considered models can serve as working hypotheses for the gating of BK channels.


Figures

Scheme S1
Scheme S1
Scheme S7
Scheme S7
Scheme S8
Scheme S8
Scheme S15
Scheme S15
Scheme S9
Scheme S9
Scheme S10
Scheme S10
Scheme S12
Scheme S12
Scheme S13
Scheme S13
Figure 3
Figure 3
Open and closed 1-D dwell-time distributions obtained at 5.5, 12.3, 132, and 1,024 μM Ca2+ i. The durations of open (A–D) and closed (E–H) intervals were log binned at a resolution of 25 bins/decade and plotted as the square-root of the number of intervals in each bin. The plotted open circles are the averages of two adjacent points to smooth the data for display. The thick lines plot the best fits of the distributions with mixtures of three open and five closed exponential components. The fits to the distributions at 132 μM Ca2+ i (C and G) are replotted as thin lines on the distributions at 1,024 μM Ca2+ i (D and H) to show that there is little difference between the distributions obtained at 132 and 1,024 μM Ca2+ i. The closed distribution and fits shown in H are replotted on a logarithmic scale in the inset to allow high gain comparisons of the fits to the tails of the distributions. All distributions and fits were normalized to 100,000 intervals (integrated from time zero to infinity). The actual numbers of fitted intervals in each distribution were: 5.5 μM, 4,711 open and 3,848 closed; 12.3 μM, 13,520 open and 9,826 closed; 132 μM, 14,330 open and 7,725 closed; 1,024 μM, 18,128 open and 8,510 closed. Deadtime, 28.5 μs; channel B06.
Figure 1
Figure 1
The gating of BK channels appears to kinetically saturate at high Ca2+ i. (A) Representative currents recorded from a single BK channel at 5.5, 12.3, 132, and 1,024 μM Ca2+ i and displayed at a time resolution of 1 s/trace. O and C indicate the open and closed current levels. (B) The currents recorded at high Ca2+ i displayed at a time resolution of 100 ms/trace. All data in this and the following figures was collected at +30 mV.
Figure 2
Figure 2
Increasing Ca2+ i increases P o and mean open interval duration and decreases mean closed interval duration. (A) Plot of P o vs. Ca2+ i for five single BK channels. The thick line represents a fit of the Hill equation to all the data points: formula image, where formula image. (B) Plot of mean open duration vs. Ca2+ i for the same five channels. The thick line represents a fit of the Hill equation to all the data points, where formula image. (C) Plot of mean closed duration vs. Ca2+ i for the same five channels. The thick line represents a fit of the equation formula image. (A–C) Predicted response of Fig. 10 for channel B06 (thin continuous line), channel B12 (dashed line), and channel B14 (dotted line, which is often superimposed on the thick line and not visible).
Figure 8
Figure 8
The dependencies at positions 1, 2, 4, and 5 in the dependency plots obtained at high Ca2+ i are significantly different from zero. (A–B) The significance of the dependencies in the dependency plots in Fig. 7E and Fig. F, are plotted as dependency significance, which indicates the log of the P value times the sign of the dependency at each location. Absolute values of dependency significance greater than the thick lines at +1.3 and −1.3 indicate that the dependency values are significant (P < 0.05). Absolute values of dependency significance >2 and >3 would indicate P < 0.01 and 0.001, respectively. (C–D) Reverse-angle views of the plots in A and B, respectively. Channel B12.
Figure 4
Figure 4
Numbers of significant exponential components determined from maximum likelihood fitting of dwell-time distributions are plotted as a function of Ca2+ i. Points have been offset vertically to prevent overlap. (A) Numbers of significant open components estimated from fitting 1-D open dwell-time distributions with mixtures of 1-D exponential components. (B) Numbers of significant closed components estimated from fitting 1-D closed dwell-time distributions. (C and D) Numbers of significant open and closed components estimated from fitting 2-D (open–closed) dwell-time distributions with mixtures of 2-D exponential components. With 2-D fitting, the numbers of open and closed components are determined within a single fit. The symbols for five different channels are: B06 (•), B12 (▪), B14 (▴), B16 (▾), and B04 (♦).
Scheme S14
Scheme S14
Scheme S2
Scheme S2
Scheme S3
Scheme S3
Scheme S4
Scheme S4
Scheme S5
Scheme S5
Scheme S6
Scheme S6
Figure 5
Figure 5
Fig. 4 and Fig. 5 cannot account for the 1-D dwell-time distributions from low to high Ca2+ i, while Fig. 7 and Fig. 10 can. (A–H) The predicted distributions for Fig. 4 (dotted lines), V (thin lines), and VII (thick lines) are plotted with the experimental data (○) from Fig. 3. Fig. 10 predicted distributions that essentially superimposed the thick line for Fig. 7. The rate constants used in the predictions were obtained by simultaneous maximum likelihood fitting of 2-D distributions obtained at six different Ca2+ i ranging from 5.5 to 1,024 μM. The fitted rate constants were then used with the schemes to predict the distributions. The distribution and fits in H are replotted on a logarithmic scale as an inset. Deadtime, 28.5 μs; channel B06.
Scheme S11
Scheme S11
Figure 6
Figure 6
Kinetic structure of a BK channel at 5.5, 12.3, 132, and 1,024 μM Ca2+ i. (A–D) 2-D dwell-time distributions. Adjacent open and closed intervals were binned as pairs, with the logs of the open and closed interval durations locating the bins on the x and y axes, respectively. The z axis plots the square root of the number of intervals in each bin. (E–H) Dependency plots, which present the fractional excess and deficit of interval pairs in the observed 2-D dwell-time distributions in A–D when compared with the 2-D dwell-time distributions calculated assuming independent pairing of open and closed intervals (). The thick lines indicate a dependency of zero. Channel B06.
Figure 7
Figure 7
Adjacent open- and closed-interval durations are dependent at high Ca2+ i. The kinetic structure is presented at two different levels of high Ca2+ i for channels B12 and B14. The deficit of intervals at position 1 and the excess of intervals at position 2 are consistently seen. The approximately eightfold increase in Ca2+ i from 132 to 1,024 μM has little effect on either the 2-D dwell-time distributions or the dependency plots.
Figure 9
Figure 9
Fig. 7 describes the basic features of the kinetic structure from low to intermediate Ca2+ i, but cannot describe the kinetic structure at high Ca2+ i. (A–H) Kinetic structure predicted by Fig. 7 from low to high Ca2+ i. Fig. 7 predicted little dependence at high Ca2+ i. (Compare with the experimental data in Fig. 6.) The rate constants used in the predictions were obtained by simultaneous maximum likelihood fitting of 2-D distributions obtained at six different Ca2+ i ranging from 5.5 to 1,024 μM. Fig. 7 with the same rate constants could predict the 1-D dwell-time distributions in Fig. 5 (thick line). Channel B06.
Figure 10
Figure 10
The two-tiered Fig. 10 describes the basic features of the kinetic structure from low to high Ca2+ i. (A–H) Kinetic structure predicted by Fig. 10. (Compare with the experimental data in Fig. 6.) The rate constants used in the predictions were obtained by simultaneous maximum likelihood fitting of 2-D distributions obtained at six different Ca2+ i ranging from 5.5 to 1,024 μM. Channel B06.
Figure 12
Figure 12
Estimated rate constants for Fig. 10 and Fig. 11 for three BK channels. B06 (black bar), B12 (hatched bar), and B14 (light gray bar). Rate constants in A were estimated by the simultaneous fitting of 2-D dwell-time distributions at six different Ca2+ i. Rate constants in B were estimated by the fitting of the 2-D dwell-time distributions obtained at 1,024 μM Ca2+ i only. (Rate constants for other examined schemes can be found in online supplemental Figure S2 [http://www.jgp.org/cgi/full/114/1/93/DC1].)
Figure 13
Figure 13
Single-channel current records predicted by the two-tiered Fig. 10 for comparison with the experimental current records in Fig. 1. Idealized single-channel currents were generated, noise was added, and then the entire record was filtered with a digital four-pole Bessel filter to give the same effective dead time as that in the experimental record. Fig. 10 predicts the range of activity as well as the apparent kinetic saturation in the gating at high Ca2+ i.
Figure 11
Figure 11
Fig. 5 with an assumption of saturation in the Ca2+-binding rates (Scheme V-sat in Table ) describes the kinetic structure from low to high Ca2+ i. The figure presents the predicted kinetic structure for data obtained with 1,024 μM Ca2+ i (compare with Fig. 6D and Fig. H). The rate constants used in the predictions were obtained by simultaneous maximum likelihood fitting of 2-D distributions obtained at six different Ca2+ i ranging from 5.5 to 1,024 μM. The values of the effective Ca2+ at the binding sites for the data obtained at 132 and 1,024 μM Ca2+ i were determined by fitting to maximize the likelihood during the simultaneous fitting of data obtained at the six different Ca2+ i, and were 56.9 and 60.0 μM Ca2+ i, respectively. Channel B06. The predicted kinetic structure for 132 μM Ca2+ i was similar to that plotted in A and B, and the predicted kinetic structures for the lower Ca2+ i were similar to those shown in Fig. 10.
Figure 14
Figure 14
Mechanism of the Ca2+-dependent gating of BK channels for the two-tiered model described by Fig. 10. Equilibrium occupancies, mean lifetimes, and frequencies of entry into each state are plotted on logarithmic scales for data collected at low (A–C, 5.5 μM) and high (D–F, 1,024 μM) Ca2+ i. The x axis indicates the number of bound Ca2+, and the y axis indicates the upper tier of closed states and the lower tier of open states. The inset identifies the states in the plots with the state numbers in Fig. 10. The two-tiered form of Fig. 10 places open states 1–3 directly below closed states 15–17, respectively, and open states 4–6 directly below closed states 12–14, respectively. Channel B06.

Comment in

  • Commentary: a plausible model.
    Jones SW. Jones SW. J Gen Physiol. 1999 Aug;114(2):271-5. doi: 10.1085/jgp.114.2.271. J Gen Physiol. 1999. PMID: 10436002 Free PMC article. No abstract available.

Similar articles

Cited by

References

    1. Adelman J.P., Shen E., Kavanaugh M.P., Warren R.A., Wu Y., Lagrutta A., Bond C., North R.A. Calcium-activated potassium channels expressed from cloned complementary DNAs. Neuron. 1992;9:209–216. - PubMed
    1. Akaike H. A new look at the statistical model identification. IEEE (Inst. Electr. Electron. Eng.) Trans. Auto. Control. 1974;19:716–723.
    1. Art J.J., Wu Y.-C., Fettiplace R. The calcium-activated potassium channels of turtle hair cells. J. Gen. Physiol. 1995;105:49–72. - PMC - PubMed
    1. Atkinson N.S., Robertson G.A., Ganetzky B. A component of calcium-activated potassium channels encoded by the Drosophila slo locus. Science. 1991;253:551–555. - PubMed
    1. Barrett J.N., Magleby K.L., Pallotta B.S. Properties of single calcium-activated potassium channels in cultured rat muscle. J. Physiol. 1982;331:211–230. - PMC - PubMed

Publication types

Substances