Sequence variations in human immunodeficiency virus type 1 Nef are associated with different stages of disease
- PMID: 10364298
- PMCID: PMC112607
- DOI: 10.1128/JVI.73.7.5497-5508.1999
Sequence variations in human immunodeficiency virus type 1 Nef are associated with different stages of disease
Abstract
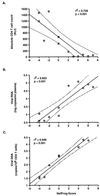
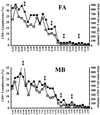
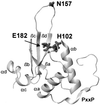
nef alleles derived from a large number of individuals infected with human immunodeficiency virus type 1 (HIV-1) were analyzed to investigate the frequency of disrupted nef genes and to elucidate whether specific amino acid substitutions in Nef are associated with different stages of disease. We confirm that deletions or gross abnormalities in nef are rarely present. However, a comparison of Nef consensus sequences derived from 41 long-term nonprogressors and from 50 individuals with progressive HIV-1 infection revealed that specific variations are associated with different stages of infection. Five amino acid variations in Nef (T15, N51, H102, L170, and E182) were more frequently observed among nonprogressors, while nine features (an additional N-terminal PxxP motif, A15, R39, T51, T157, C163, N169, Q170, and M182) were more frequently found in progressors. Strong correlations between the frequency of these variations in Nef and both the CD4(+)-cell count and the viral load were observed. Moreover, analysis of sequential samples obtained from two progressors revealed that several variations in Nef, which were more commonly observed in patients with low CD4(+)-T-cell counts, were detected only during or after progression to immunodeficiency. Our results indicate that sequence variations in Nef are associated with different stages of HIV-1 infection and suggest a link between nef gene function and the immune status of the infected individual.
Figures


Similar articles
-
Structural defects and variations in the HIV-1 nef gene from rapid, slow and non-progressor children.AIDS. 2003 Jun 13;17(9):1291-301. doi: 10.1097/00002030-200306130-00003. AIDS. 2003. PMID: 12799550
-
Defective nef alleles in a cohort of hemophiliacs with progressing and nonprogressing HIV-1 infection.Virology. 1999 Jul 5;259(2):349-68. doi: 10.1006/viro.1999.9783. Virology. 1999. PMID: 10388660
-
Natural variation of the nef gene in human immunodeficiency virus type 2 infections in Portugal.J Gen Virol. 2003 May;84(Pt 5):1287-1299. doi: 10.1099/vir.0.18908-0. J Gen Virol. 2003. PMID: 12692296
-
Functional and structural defects in HIV type 1 nef genes derived from pediatric long-term survivors.AIDS Res Hum Retroviruses. 2000 Nov 20;16(17):1855-68. doi: 10.1089/08892220050195810. AIDS Res Hum Retroviruses. 2000. PMID: 11118071
-
Cytotoxic T lymphocytes in human immunodeficiency virus infection: regulator genes.Curr Top Microbiol Immunol. 1994;189:65-74. doi: 10.1007/978-3-642-78530-6_4. Curr Top Microbiol Immunol. 1994. PMID: 7924437 Review. No abstract available.
Cited by
-
Genetic defects in the nef gene are associated with Korean Red Ginseng intake: monitoring of nef sequence polymorphisms over 20 years.J Ginseng Res. 2017 Apr;41(2):144-150. doi: 10.1016/j.jgr.2016.02.005. Epub 2016 Mar 3. J Ginseng Res. 2017. PMID: 28413318 Free PMC article.
-
Contribution of Vpu, Env, and Nef to CD4 down-modulation and resistance of human immunodeficiency virus type 1-infected T cells to superinfection.J Virol. 2006 Aug;80(16):8047-59. doi: 10.1128/JVI.00252-06. J Virol. 2006. PMID: 16873261 Free PMC article.
-
Human Immunodeficiency Virus nef signature sequences are associated with pulmonary hypertension.AIDS Res Hum Retroviruses. 2012 Jun;28(6):607-18. doi: 10.1089/AID.2011.0021. Epub 2012 Jan 17. AIDS Res Hum Retroviruses. 2012. PMID: 22066947 Free PMC article.
-
Immune selection in vitro reveals human immunodeficiency virus type 1 Nef sequence motifs important for its immune evasion function in vivo.J Virol. 2012 Jul;86(13):7126-35. doi: 10.1128/JVI.00878-12. Epub 2012 May 2. J Virol. 2012. PMID: 22553319 Free PMC article.
-
Characterization of a thymus-tropic HIV-1 isolate from a rapid progressor: role of the envelope.Virology. 2004 Oct 10;328(1):74-88. doi: 10.1016/j.virol.2004.07.019. Virology. 2004. PMID: 15380360 Free PMC article.
References
-
- Baur A S, Sawai E T, Dazin P, Fantl W J, Cheng-Mayer C, Peterlin B M. HIV-1 Nef leads to inhibition or activation of T cells depending on its intracellular localization. Immunity. 1994;1:373–384. - PubMed
-
- Carl, S., R. Daniels, A. J. Iafrate, M. Troop, P. Easterbrook, J. Skowronski, and F. Kirchhoff. Partial “repair” of defective nef genes in a long-term nonprogressor of HIV-1 infection selectively restores the ability of Nef to enhance infectivity and to down-modulate MHC class I cell surface expression. Submitted for publication.
Publication types
MeSH terms
Substances
Associated data
- Actions
- Actions
- Actions
- Actions
- Actions
- Actions
- Actions
- Actions
- Actions
- Actions
- Actions
- Actions
- Actions
- Actions
- Actions
- Actions
- Actions
- Actions
- Actions
- Actions
- Actions
- Actions
- Actions
- Actions
- Actions
- Actions
- Actions
- Actions
- Actions
- Actions
Grants and funding
LinkOut - more resources
Full Text Sources
Medical
Molecular Biology Databases
Research Materials

