. 1999 Jun 1;13(11):1382-97.
doi: 10.1101/gad.13.11.1382.

Inflammatory mast cells up-regulate angiogenesis during squamous epithelial carcinogenesis

Affiliations

Inflammatory mast cells up-regulate angiogenesis during squamous epithelial carcinogenesis

L M Coussens et al. Genes Dev. .

Abstract

Expression of HPV16 early region genes in basal keratinocytes of transgenic mice elicits a multistage pathway to squamous carcinoma. We report that infiltration by mast cells and activation of the matrix metalloproteinase MMP-9/gelatinase B coincides with the angiogenic switch in premalignant lesions. Mast cells infiltrate hyperplasias, dysplasias, and invasive fronts of carcinomas, but not the core of solid tumors, where they degranulate in close apposition to capillaries and epithelial basement membranes, releasing mast-cell-specific serine proteases MCP-4 (chymase) and MCP-6 (tryptase). MCP-6 is shown to be a mitogen for dermal fibroblasts that proliferate in the reactive stroma, whereas MCP-4 can activate progelatinase B and induce hyperplastic skin to become angiogenic in an in vitro bioassay. Notably, premalignant angiogenesis is abated in a mast-cell-deficient (KITW/KITWWv) HPV16 transgenic mouse. The data indicate that neoplastic progression in this model involves exploitation of an inflammatory response to tissue abnormality. Thus, regulation of angiogenesis during squamous carcinogenesis is biphasic: In hyperplasias, dysplasias, and invading cancer fronts, inflammatory mast cells are conscripted to reorganize stromal architecture and hyperactivate angiogenesis; within the cancer core, upregulation of angiogenesis factors in tumor cells apparently renders them self-sufficient at sustaining neovascularization.


Figures

Figure 1
Figure 1
Altered morphology and architecture of capillaries during premalignant neovascularization. Immunohistochemical staining of 5-μm paraffin-embedded tissue sections for CD31 expressed on capillary endothelial cells (red staining) counterstained with methyl green in (A) normal nontransgenic (-lm) ear skin, (B) hyperplastic (hyp) ear skin, (C) dysplastic (dys) ear skin, (D) ear WDSC, (E) truncal M-PDSC center, and (F) the invasive front (Inv front) of a truncal M-PDSC with arrows indicating direction of tumor expansion. (Dashed line) Epidermal–dermal interface or location of skin basement membrane zone; (e) epidermis. Bar, 44.6 μm (A–F).
Figure 2
Figure 2
Mast cell infiltration during activation of angiogenesis. Chloroacetate esterase histochemistry (red staining) on 5-μm paraffin-embedded tissue sections counterstained with hematoxylin (blue) identifies location of infiltrating MCs during neoplastic progression in (A) nontransgenic litter mate (-lm) ear skin, (B) hyperplastic (hyp) ear skin, (C and D) dysplastic (dys) ear skin, (E) the center of a chest M-PDSC, (F) and at the invading front of a truncal M-PDSC. Arrows indicate direction of tumor expansion. (G) Whole-mount microscopy of lectin-perfused transgenic mouse with dysplastic truncal lesions. Darkly stained mast cells (arrows) appear to adhere directly to basement membranes surrounding the dermal capillaries (c) in angiogenic dysplasias. (H) Metachromatic granules in MCs stained with toluidine blue. Degranulating mast cells (arrows) present within a dysplastic lesion are juxtaposed tightly to skin basement membrane (bm) and dermal capillaries (c, arrowhead). (d) Dermis, (e) epidermis. Bar, 44.6 μm (A–D, F); 89 μm (E); 19.7 μm (G); 12.9 μm (H).
Figure 2
Figure 2
Mast cell infiltration during activation of angiogenesis. Chloroacetate esterase histochemistry (red staining) on 5-μm paraffin-embedded tissue sections counterstained with hematoxylin (blue) identifies location of infiltrating MCs during neoplastic progression in (A) nontransgenic litter mate (-lm) ear skin, (B) hyperplastic (hyp) ear skin, (C and D) dysplastic (dys) ear skin, (E) the center of a chest M-PDSC, (F) and at the invading front of a truncal M-PDSC. Arrows indicate direction of tumor expansion. (G) Whole-mount microscopy of lectin-perfused transgenic mouse with dysplastic truncal lesions. Darkly stained mast cells (arrows) appear to adhere directly to basement membranes surrounding the dermal capillaries (c) in angiogenic dysplasias. (H) Metachromatic granules in MCs stained with toluidine blue. Degranulating mast cells (arrows) present within a dysplastic lesion are juxtaposed tightly to skin basement membrane (bm) and dermal capillaries (c, arrowhead). (d) Dermis, (e) epidermis. Bar, 44.6 μm (A–D, F); 89 μm (E); 19.7 μm (G); 12.9 μm (H).
Figure 3
Figure 3
Chymase and tryptase in neoplastic skin. (A) Chymotryptic and tryptic activity in neoplastic skin. Values represent mean chymase and tryptase activity in ear skin biopsies from negative littermate (N), hyperplastic (H), dysplastic (D), and tumor (T) solubilized by extraction at high ionic strength, normalized to the amount of protein in extracts ±s.e.m.); 5-μl each of tissue sample were incubated with 1 mm chymotryptic or tryptic substrate. The change in absorbance at 410 nm at 37°C is shown where units indicate μmoles of substrate cleaved/min per mg protein. (B) RT–PCR analysis for all mMCPs in dysplastic ear mRNA. Sizes shown indicate base pairs. All primer pairs were tested for specific priming of control RNA. (C) SDS-PAGE of mMCP-4 purification from K14–HPV16 mouse ears. Samples were reduced with dithiothreitol and visualized with Coomassie brilliant blue. (Lane 1), 2 m NaCl extract of K14-HPV mouse ears (5 μg of protein); (lane 2) 2 m NaCl extract SBTI-agarose unbound fraction (1 μg of protein); (lane 3), 5 μg of pure mMCP-4, SBTI-agarose acid eluate. (D) Anti-rat MCP-1 IgG reacts specifically with mMCP-4. (Lane 1) Crude high-salt extract of ears (2 μl); (lane 2), 2.5 ng of purified mMCP-4 from SBTI-agarose acid eluate. (E) SDS-PAGE of mMCP-6 purification from K14–HPV16 mouse ears. Samples were reduced with dithiothreitol and visualized with Coomassie brilliant blue. (Lane 1) Unbound fraction from p-aminobenzamidine–agarose chromatography, 2 μl; (lane 2), 2 m NaCl extract, unbound fraction, 2 μl; (lane 3) MMCP-6 peak (240 ng) from heparin–HPLC NaCl gradient elution. Molecular masses are shown in kD.
Figure 3
Figure 3
Chymase and tryptase in neoplastic skin. (A) Chymotryptic and tryptic activity in neoplastic skin. Values represent mean chymase and tryptase activity in ear skin biopsies from negative littermate (N), hyperplastic (H), dysplastic (D), and tumor (T) solubilized by extraction at high ionic strength, normalized to the amount of protein in extracts ±s.e.m.); 5-μl each of tissue sample were incubated with 1 mm chymotryptic or tryptic substrate. The change in absorbance at 410 nm at 37°C is shown where units indicate μmoles of substrate cleaved/min per mg protein. (B) RT–PCR analysis for all mMCPs in dysplastic ear mRNA. Sizes shown indicate base pairs. All primer pairs were tested for specific priming of control RNA. (C) SDS-PAGE of mMCP-4 purification from K14–HPV16 mouse ears. Samples were reduced with dithiothreitol and visualized with Coomassie brilliant blue. (Lane 1), 2 m NaCl extract of K14-HPV mouse ears (5 μg of protein); (lane 2) 2 m NaCl extract SBTI-agarose unbound fraction (1 μg of protein); (lane 3), 5 μg of pure mMCP-4, SBTI-agarose acid eluate. (D) Anti-rat MCP-1 IgG reacts specifically with mMCP-4. (Lane 1) Crude high-salt extract of ears (2 μl); (lane 2), 2.5 ng of purified mMCP-4 from SBTI-agarose acid eluate. (E) SDS-PAGE of mMCP-6 purification from K14–HPV16 mouse ears. Samples were reduced with dithiothreitol and visualized with Coomassie brilliant blue. (Lane 1) Unbound fraction from p-aminobenzamidine–agarose chromatography, 2 μl; (lane 2), 2 m NaCl extract, unbound fraction, 2 μl; (lane 3) MMCP-6 peak (240 ng) from heparin–HPLC NaCl gradient elution. Molecular masses are shown in kD.
Figure 4
Figure 4
Effects of tryptase on skin fibroblasts. Effect of MCPs on HUVEC proliferation (A) and on PMDF proliferation (B). Agonists were added to subconfluent, serum-deprived cultures (VEGF, 1 and 10 ng/ml; bFGF, 1 and 10 ng/ml; mMCP-6, 1 and 10 nm; mMCP-4, 2 and 20 nm; heparin at 74 and 740 ng/ml) for 16 hr. [3H]Thymidine incorporation was then determined. Results shown indicate mean values (±s.e.m.; n = 3). (C–E) Dark-field photographs of ear-tissue sections from (C) negative litter mate (-lm) normal skin, (D) hyperplastic (hyp) skin, and (E) dysplastic (dys) skin hybridized with a (α1)I procollagen antisense mRNA probe. Arrows point to procollagen expressing cells within the stroma. (e) Epidermis; (d) dermis, (c) central ear cartilage. Bar, 44.6 μm (C–E).
Figure 5
Figure 5
Effect of mMCP-4 on progelatinase B present in hyperplastic tissue and localization of mMCP-4 and gelatinase B in vivo. (A) Gelatinolytic activity in tissue lysates (2 μl) from normal (N), hyperplastic (H), dysplastic (D) and carcinoma (T) biopsies. Incubation of gelatin zymograms with 1,10 phenanthroline (an inhibitor of MMPs), but not PMSF (an inhibitor of serine proteases) following electrophoresis abolished the 68, 72, 80, and 90-kD bands completely (data not shown). (B) In vitro reconstitution of gelatinase B activity. Two microliters of hyperplastic (H) lysate alone or 2 μl of hyperplastic lysate incubated for 30 min at 37°C with 40 ng of purified mMCP-4. Molecular masses are shown in kD. (C–D) Immunolocalization of mMCP-4 (red staining) and laminin (brown staining) at basement membranes (bm, arrows) adjacent to epithelium (e) and capillaries (c) in dysplastic skin. (E) Immunolocalization of gelatinase B (blue staining) in dysplastic skin localizes to basement membranes (bm) adjacent to epithelium (e, closed arrows) and around capillaries (c, open arrows) in dermis. (F) Control for nonspecific binding using a control rabbit IgG; background staining was negligible. Bar, 44.6 μm (C–F).
Figure 5
Figure 5
Effect of mMCP-4 on progelatinase B present in hyperplastic tissue and localization of mMCP-4 and gelatinase B in vivo. (A) Gelatinolytic activity in tissue lysates (2 μl) from normal (N), hyperplastic (H), dysplastic (D) and carcinoma (T) biopsies. Incubation of gelatin zymograms with 1,10 phenanthroline (an inhibitor of MMPs), but not PMSF (an inhibitor of serine proteases) following electrophoresis abolished the 68, 72, 80, and 90-kD bands completely (data not shown). (B) In vitro reconstitution of gelatinase B activity. Two microliters of hyperplastic (H) lysate alone or 2 μl of hyperplastic lysate incubated for 30 min at 37°C with 40 ng of purified mMCP-4. Molecular masses are shown in kD. (C–D) Immunolocalization of mMCP-4 (red staining) and laminin (brown staining) at basement membranes (bm, arrows) adjacent to epithelium (e) and capillaries (c) in dysplastic skin. (E) Immunolocalization of gelatinase B (blue staining) in dysplastic skin localizes to basement membranes (bm) adjacent to epithelium (e, closed arrows) and around capillaries (c, open arrows) in dermis. (F) Control for nonspecific binding using a control rabbit IgG; background staining was negligible. Bar, 44.6 μm (C–F).
Figure 6
Figure 6
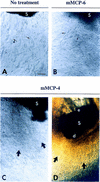
Effect of mMCP-4 on sequestered angiogenic activity in premalignant tissue. Hyperplastic ear skin (S) from a 1-month old K14–HPV16 mouse was incubated for 48 hr in the presence or absence of enzymes at 37°C followed by implantation into a collagen gel with EC coculture. Cultures were maintained for 3 weeks, with photographs of tube ingrowths taken after 12 days of coculture. (A) untreated ear skin implanted into EC-collagen gel; (B) mMCP-6-treated (10 nm) ear skin implanted into EC-collagen gel; (C and D) mMCP-4-treated (20 nm) ear skin implanted into EC-collagen gel showing an angiogenic response with extensive EC tube formation. Lower magnification (D) shows the polarized direction of tubular structures towards the dermal (d) surface, as opposed to the epidermal (e) surface of the skin. Small arrows (A and B) indicate the more-or-less random growth of ECs, whereas thick arrows (C and D) indicate radially aligned tubules growing toward the skin piece. (h) Hair. Bar: 58 μm (A–C); 116 μm (D).
Figure 7
Figure 7
Mast cell deficiency abates early neoplastic progression. Presence of mast cells (CAE, red staining; A–C), proliferation of keratinocytes (Ki-67, brown staining; D–F), and capillary architecture and densities (CD-31, brown staining; panels G–I) were compared between wild-type littermates (-LM; n = 3; A, D, and G), K14–HPV16 KIT+/KIT+ (n = 8; B, E, and H), and K14–HPV16 KITW/KITWWv (n = 1; C, F, and I) mice. Ear tissue biopsies (5 × 2-mm) were removed from 2-month old littermates, embedded in OCT freezing medium, and sectioned (10 μm). Dashed line indicates epidermal–dermal interface. Arrows point to dilated capillaries subjacent to hyperplastic skin. (f) Hair follicle. Bar, 44.6 μm (A–I).
Figure 8
Figure 8
A model for biphasic control of angiogenesis during squamous carcinogenesis. Skin is compartmentalized into an avascular epidermis, composed of keratinocytes and dendritic cells, and a vascularized dermis composed of fibroblasts, various hemopoietic cell types, and endothelial and smooth muscle cells forming blood vessels, embedded in a quiescent stromal milieu. During premalignant progression, stroma adjacent to neoplastic epithelium resembles that observed in chronic wounds characterized by proliferating fibroblasts, increased synthesis of α1(I) procollagen, increased vessel density, vascular permeability, increased expression and activity of ECM-degrading proteinases, increased presence of diverse leukocytes, and degranulation of MCs. MCs are exploited by neoplastic epithelia in early lesions and act to jump-start angiogenesis by their release of several bioactive molecules, e.g., bFGF, VEGF, heparin, histamine, chymase, and tryptase. Tryptase increases vascular permeability, and is a potent mitogen and activator of fibroblasts and inducer of α1(I) procollagen synthesis. Chymase, although not a direct mitogen, induces activation of angiogenesis by releasing sequestered angiogenic activity from stromal reservoirs, through gelatinase B-dependent and independent mechanisms. Gelatinase B made by reactive stromal cells, although likely involved in ECM-remodeling, releases ECM-sequestered angiogenic activity also stimulating EC chemotaxis, proliferation, and tube formation. In contrast, maintenance of neovascularization within tumor stroma is MC-independent. Sustaining angiogenesis within the cancer phase is likely accomplished directly via dramatic up-regulation of multiple heparin-binding growth factor genes in fully malignant epithelial cells.

Similar articles

Cited by

References

    1. Aaltomaa S, Lipponen P, Papinaho S, Kosma V-M. Mast cells in breast cancer. Anticancer Res. 1993;13:785–788. - PubMed
    1. Adler RR, Brenner CA, Werb Z. Expression of extracellular matrix-degrading metalloproteinases and metalloproteinase inhibitors is developmentally regulated during endoderm differentiation of embryonal carcinoma cells. Development. 1990;110:211–220. - PubMed
    1. Arbeit J, Munger K, Howley P, Hanahan D. Progressive squamous epithelial neoplasia in K14-human papillomavirus type 16 transgenic mice. J Virol. 1994;68:358–368. - PMC - PubMed
    1. Arbeit JM, Olson D, Hanahan D. Upregulation of fibroblast growth factors and their receptors during multi-stage epidermal carcinogenesis in K14–HPV16 transgenic mice. Oncogene. 1996;13:1847–1857. - PubMed
    1. Bashkin P, Razin E, Eldor A, Vlodavsky I. Degranulating mast cells secrete an endoglycosidase which degrades heparin sulfate in subendothelial extracellular matrix. Blood. 1990;75:2204–32212. - PubMed

Publication types

LinkOut - more resources