. 1999 May 3;145(3):589-604.
doi: 10.1083/jcb.145.3.589.

Separation of propulsive and adhesive traction stresses in locomoting keratocytes

Affiliations

Separation of propulsive and adhesive traction stresses in locomoting keratocytes

T Oliver et al. J Cell Biol. .

Abstract

Strong, actomyosin-dependent, pinching tractions in steadily locomoting (gliding) fish keratocytes revealed by traction imaging present a paradox, since only forces perpendicular to the direction of locomotion are apparent, leaving the actual propulsive forces unresolved. When keratocytes become transiently "stuck" by their trailing edge and adopt a fibroblast-like morphology, the tractions opposing locomotion are concentrated into the tail, leaving the active pinching and propulsive tractions clearly visible under the cell body. Stuck keratocytes can develop approximately 1 mdyn (10,000 pN) total propulsive thrust, originating in the wings of the cell. The leading lamella develops no detectable propulsive traction, even when the cell pulls on its transient tail anchorage. The separation of propulsive and adhesive tractions in the stuck phenotype leads to a mechanically consistent hypothesis that resolves the traction paradox for gliding keratocytes: the propulsive tractions driving locomotion are normally canceled by adhesive tractions resisting locomotion, leaving only the pinching tractions as a resultant. The resolution of the traction pattern into its components specifies conditions to be met for models of cytoskeletal force production, such as the dynamic network contraction model (Svitkina, T.M., A.B. Verkhovsky, K.M. McQuade, and G.G. Borisy. 1997. J. Cell Biol. 139:397-415). The traction pattern associated with cells undergoing sharp turns differs markedly from the normal pinching traction pattern, and can be accounted for by postulating an asymmetry in contractile activity of the opposed lateral wings of the cell.


Figures

Figure 1
Figure 1
Side and top view of flowchamber, modified from an apparatus designed by Dr. Joseph Wolenski for molecular motility assays (personal communication, 1995 Physiology Course; Marine Biology Laboratory). Two cover glasses, 25 × 50 and 25 × 40 mm, form the “floor” and “roof,” respectively, of a flowcell that is open at each end, but closed on its long sides by glass or plastic spacers. Vacuum grease is used to assemble these components and is also used to surround each entrance to the flowcell with circular “berms.” These grease enclosures permit drugs or appropriate medium changes to be introduced into the chamber from one side with a Pasteur pipette and aspirated from the other side with a finely drawn out plastic transfer pipette or filter paper cut into strips. This can be easily done without leaking fluid onto the microscope or disturbing the position of the stage. Cells are allowed to attach to one face of the chamber interior before assembly; alternatively, they may be introduced into the chamber as a cell suspension and allowed to settle out onto the chamber floor. To facilitate handling, the flowchamber is attached to a flat aluminum plate, similar in overall dimensions to a regular glass microscope slide. A cutout in this plate permits good optical contact to be made between the chamber and oil immersion objectives and condensers, on either an upright or an inverted microscope. In addition, the rigidity of this plate prevents the glass chamber from flexing during focusing of oil immersion objectives. This basic design was further modified by incorporating an island of silicone rubber onto the floor of the chamber, onto which single cells were attached before assembly. In this configuration of the flow chamber, thicker spacers and long working distance objectives were required to access the focal plane of the cells.
Figure 2
Figure 2
(a) Phase contrast micrograph of a keratocyte engaged in steady state gliding locomotion on a silicone rubber substratum with embedded beads, in the direction indicated by the large arrow. Cell is outlined in white for clarity. (b) Traction map for the same cell. Each small arrow represents the magnitude and direction of the traction stress at the location corresponding to the tail of the arrow. (c) The same data as in b with “bootstrap” tractions. This statistical treatment of the data indicates graphically the level of confidence in the traction stresses after randomly generated noise is added to the bead displacements. The tighter the angular distribution of tractions, the better the level of confidence in the direction of the traction vector. (d) Differential interference contrast image of a keratocyte locomoting on a strongly cross-linked silicone rubber substratum. Note the large compression wrinkle beneath and parallel to the cell's axis of locomotion. The cell is moving forward in the direction shown by the arrow. Bars: 10 μm.
Figure 3
Figure 3
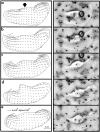
Time-lapse traction map series for a keratocyte undergoing steady gliding in a straight line. Bold arrow indicates direction of locomotion. Time interval between panels is 30 s.
Figure 4
Figure 4
The effect of BDM and H7 on keratocytes locomoting on glass substrata. (a–c) DIC time-lapse images from a flowchamber experiment illustrate typical behavior of a single killifish keratocyte before (a), during (b), and after (c) perfusion with 10 mM BDM. This rapidly locomoting cell was kept in the microscope's field of view (image is ∼65 μm wide) over the course of the experiment by tracking it with the microscope stage. (d–f) DIC time lapse images from another flowchamber experiment illustrate the behavior of a sample of goldfish keratocytes before (d), during (e), and after (f) perfusion with 750 μM H7. Cells in control medium (d) were predominantly polarized, fan shaped, and locomoting. 7 min after the application of H7 (e), most cells were stationary and had a “fried-egg” morphology. Observation was continued for 73 min of exposure to H7. (f) 13 min after the drug was washed out with control medium, cells have regained their locomotory (fan-shaped) morphology. Few cells detached, despite their loss of polarity in the presence of H7. Field of view is fixed and ∼350-μm wide. Arrows on various panels indicate direction of locomotion for particular cells.
Figure 5
Figure 5
The effect of BDM on a single keratocyte locomoting on wrinkling substrata. Time-lapse images from a flowchamber experiment before (a), during (b), and after (c) perfusion with 50 mM BDM. Cell margins are outlined in black for clarity. Arrows indicate direction of cell locomotion. Bar, 25 μm.
Figure 6
Figure 6
Summary histogram of relative wrinkling (measured as described in Materials and Methods) in the presence and absence of BDM and KT 5926.
Figure 7
Figure 7
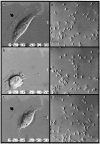
Traction maps for three cells, a–b, c, and d, whose trailing edges have adhered to sticky patches on nonwrinkling silicone substratum. The first two maps are accompanied by original phase contrast micrographs of the cell. S indicates the location of a sticky patch at the rear of each cell in c and d. Bold arrows indicate direction of locomotion. Time interval separating images a and b is 50 s.
Figure 8
Figure 8
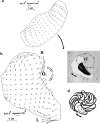
(a) The traction map for a cell making a long radius turn to the right shows features similar to steady state cells. Bold curved arrow indicates the cell's trajectory. (b) Traction map for a cell making a short-radius turn, clockwise about pivot point O on the substratum. (c) Trajectory plotted (arrowed circle) over 24 min of circling locomotion, superimposed over total cell area (white plus black) and nuclear area (black) for the cell traction map shown in b. (d) Successive nuclear profiles for the same cell, recorded over 24 min of circling locomotion around pivot point O. For discussion purposes, R and L designate right and left sides of the cell.
Figure 9
Figure 9
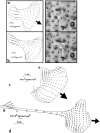
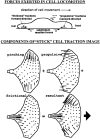
(top) Forces exerted in cell locomotion. A locomoting cell attached to a substratum experiences several component forces that comprise reactions (a) to rearward-directed propulsive forces (a′) exerted by the cell's molecular motors, viscous drag (b) between the cell and the aqueous medium, and reactions (c) to forward-directed frictional tractions (c′) caused by tension in the adhesive bonds to the substratum. The net force required to move the keratocyte smoothly forward in a low viscosity medium is negligible because both the inertia of the cell and the viscosity of the aqueous medium are so small. (bottom) Components of stuck cell traction image. In stuck cells, it may be presumed that all friction is concentrated in the well-defined “tail” and that the traction in the cell body represents pure isometric motor activity. The traction patterns of stuck cells can be decomposed into pinching, propulsive, frictional, and resultant tractions. Pinching tractions are concentrated in the wings of the cell and are negligible near the midline and the leading edge. They are the direct result of motor activity, but they are perpendicular to the normal direction of locomotion, so they apply no propulsive thrust. Propulsive tractions have a similar distribution to the pinching tractions and are also due to direct motor activity. The difference is that they are oriented so as to provide forward thrust for locomotion. Frictional tractions (everything left over) oppose (by definition) the forward motion of the cell and are not due to direct motor activity. In the stuck cell, they are concentrated in the tail as shown, but in other cases they may have different distributions (see below). Resultant tractions are the prediction for the observed traction image (compare with Fig. 7 b). Each vector is computed by simple point-by-point vector addition of the pinching, propulsive, and frictional tractions. The total area integral of x and y components of force and torque about an arbitrary origin must always be zero. The arrow indicates the direction of cell locomotion.
Figure 10
Figure 10
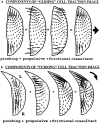
(a) Starting with the traction pattern of the stuck cell, we generate the gliding cell by a simple redistribution of the frictions. The pinching and propulsive tractions are essentially unchanged from the case of the stuck cell. The only difference is that the frictional tractions are now distributed in the wings of the cell such that when the traction fields are added together the frictions cancel the propulsive tractions. This leaves the pinching tractions as the visible remainder (resultant). The arrow indicates the direction of cell locomotion. (b) Components of traction image for a cell turning clockwise. Note that the pinching tractions on the right half of the cell are slightly stronger than on the left. This tends to drive the cell sideways (to the right) like a crab. The propulsive tractions on the left of the cell are slightly stronger than on the right. This provides a net torque tending to cause clockwise rotation. Frictional tractions are required to oppose and cancel the forces and the torque. This means that they must have the general direction as shown and that they must be collected far on the left side of the cell to have sufficient moment arm. The qualitative pattern (resultant) obtained by adding these components reproduces the main features of the pattern shown in Fig. 8 b. In particular, this model reproduces the clockwise direction of the traction vector field seen on the cell's left (outside of turn). The arrow indicates the direction of cell locomotion. For discussion purposes, R and L designate right and left sides of cell.
Figure 11
Figure 11
(a) Proposed relationship between contractility, adhesion, and traction pattern for locomoting keratocyte. (Left) DNC model (Svitkina et al., 1977) showing the orthogonal actin network (cross-hatch), with clusters of myosin II bipolar filaments (small v's) that increase in density towards the lamellipodial–cell body transition zone (curved double line). Compression of actin filaments and myosin bundling in this zone is proposed to generate the cytoskeletal contractility that drives forward translocation of the cell body (arrow). (Center) Interference reflection microscopy image showing the crescent-shaped area of close contact beneath a live keratocyte locomoting on a glass substratum (courtesy of Dr. Juliet Lee, University of Connecticut at Storrs). (Right) The sum of active (pinching and propulsive) traction distributions revealed by mapping traction stresses beneath the cell. (b) Possible modifications to the DNC model. Actomyosin contractility along a proposed equatorial, sarcomere-like structure (1) generates pinching tractions (2) and breaks adhesive bonds beneath retraction fibers (3). DNC generates propulsive tractions in the “wings” of the cell (4), but is downregulated at the front leading edge (5).

Similar articles

Cited by

References

    1. Anderson KI, Wang Y-L, Small JV. Coordination of protrusion and translocation of the keratocyte involves rolling of the cell body. J Cell Biol. 1996;134:1209–1218. - PMC - PubMed
    1. Bereiter-Hahn J, Strohmeier R, Kunzenbacher I, Beck K, Voth M. Locomotion of Xenopusepidermal cells in primary culture. J Cell Sci. 1981;52:289–311. - PubMed
    1. Bereiter-Hahn J, Luers H. Subcellular tension fields and mechanical resistance of the lamellar front related to the direction of locomotion. Cell Biochem Biophys. 1998;29:243–262. - PubMed
    1. Burton K, Taylor DL. Traction forces of cytokinesis measured with optically modified elastic substrata. Nature. 1997;385:450–454. - PubMed
    1. Chen W-T. Mechanism of retraction of the trailing edge during fibroblast movement. J Cell Biol. 1981;90:187–200. - PMC - PubMed

Publication types