. 1999 Apr 19;189(8):1315-28.
doi: 10.1084/jem.189.8.1315.

Two roads diverged: interferon alpha/beta- and interleukin 12-mediated pathways in promoting T cell interferon gamma responses during viral infection

Affiliations

Two roads diverged: interferon alpha/beta- and interleukin 12-mediated pathways in promoting T cell interferon gamma responses during viral infection

L P Cousens et al. J Exp Med. .

Abstract

Viral infections induce CD8 T cell expansion and interferon (IFN)-gamma production for defense, but the innate cytokines shaping these responses have not been identified. Although interleukin (IL)-12 has the potential to contribute, IL-12-dependent T cell IFN-gamma has not been detected during viral infections. Moreover, certain viruses fail to induce IL-12, and elicit high levels of IFN-alpha/beta to negatively regulate it. The endogenous factors promoting virus-induced T cell IFN-gamma production were defined in studies evaluating CD8 T cell responses during lymphocytic choriomeningitis virus infections of mice. Two divergent supporting pathways were characterized. Under normal conditions of infections, the CD8 T cell IFN-gamma response was dependent on endogenous IFN-alpha/beta effects, but was IL-12 independent. In contrast, in the absence of IFN-alpha/beta functions, an IL-12 response was revealed and substituted an alternative pathway to IFN-gamma. IFN-alpha/beta-mediated effects resulted in enhanced, but the alternative pathway also promoted, resistance to infection. These observations define uniquely important IFN-alpha/beta-controlled pathways shaping T cell responses during viral infections, and demonstrate plasticity of immune responses in accessing divergent innate mechanisms to achieve similar ultimate goals.


Figures

Figure 1
Figure 1
Development and testing of IL-12p35 KO mice. (A) Strategy for targeted disruption of the IL-12p35 locus is given. The IL-12p35 genomic structure is represented; closed boxes indicate location of the coding regions, which are numbered beneath, and white boxes indicate noncoding regions. The IL-12p35 targeting vector was constructed in the pBS SK+ vector and engineered by replacing a 5-kb HindIII-XbaI fragment containing exons 1–4 with a 1.6-kb neomycin resistance gene, represented as a striped box, under control of the PGK promoter. A 2.3-kb thymidine kinase cassette, represented as a stippled box, also under the control of the MC1 promoter, was inserted immediately adjacent to the 3′ end of the IL-12p35 genomic flanking sequence. A 1-kb Kpn1-XbaI fragment located downstream of exon 7, used as a probe for genomic Southern blot analysis, is indicated by a closed bar beneath. The size and location of fragments predicted for wild-type and mutant alleles expected during Southern analysis are indicated by double-headed arrows. The targeting construct was linearized at the pBS NotI site and electroporated into J1 embryonic stem cells grown and cultured under G418 and Gancyclovir selection. Restriction enzyme sites are indicated as follows: N, NeoI; H, HindIII; B, BamHI; X, XbaI; V, EcoRV; and K, KpnI. (B) Mouse genotyping using genomic Southern analysis. Genomic DNA was extracted from tail fragments of IL-12p35 +/+, IL-12p35 +/−, and IL-12p35 −/− mice. After BamHI/EcoRV restriction digestion, DNA was fractionated on 0.8% agarose gel, blotted onto membranes, and hybridized with 32P-labeled probe. (C) LPS induction of IL-12p70 expression. IL-12p35 +/+ and IL-12p35 −/− mice were injected with 500 μg/kg LPS. Blood was collected for serum sample preparation at 2.5 and 5 h after LPS injections. IL-12p70 was detected in an ELISA. Results are representative of two identical experiments containing six mice per group and are shown as means ± SEM. (D) MCMV induction of IL-12p70 and IFN-γ expression. IL-12p35 +/+ and IL-12p35 −/− mice were either uninfected or infected with 5 × 10⁴ PFU of Smith strain MCMV for 36 h and serum was prepared. IL-12p70 was measured by antibody capture and use in a biological assay. IFN-γ was measured in an ELISA. Results represent experiments containing three mice per group and are shown as means ± SEM.
Figure 2
Figure 2
T cell responses in mice lacking endogenous sources of either IL-12 or IFN-α/β. Mice, WT and IL-12p35 KO 129/B6 (A–C) or WT and IFN-α/βR KO 129 (D–F), were either uninfected (open bars or symbols) or infected i.p. (closed bars or symbols) on day 0 with 2 × 10⁴ PFU LCMV Armstrong strain. On day 8 after infection, blood and spleens were harvested and processed. Total numbers of CD8 T cell splenic leukocytes were calculated by multiplying the percentages of CD8 cells, determined by flow cytometry, with the total cell yields (A and D). IFN-γ levels were measured, in media conditioned with splenic leukocytes and in serum samples, by ELISA (B and E). For flow cytometric analysis of cytoplasmic IFN-γ expression, splenic leukocytes were stimulated for 6 h with anti–CD3, with Brefeldin A during the last 2 h. Cells were collected and stained for cell surface expression of CD8, CD4, and cytoplasmic expression of IFN-γ (C and F). Histogram plots were formed by gating on the CD8 population, and displaying CD8 T cell number versus IFN-γ fluorescence intensity. Numbers of CD8 T cells expressing IFN-γ were calculated by multiplying the percentage of CD8 T cells expressing IFN-γ by the number of CD8 T cells per spleen (× 106), and given as means ± SEM. Results are representative of two or more repetitive experiments with two to four mice per uninfected group and three to four mice per infected group. Data are shown as means ± SEM.
Figure 3
Figure 3
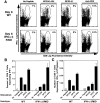
Specificity of CD8 T cell expansion after LCMV infection of IFN-α/βR KO mice. WT and IFN-α/βR KO mice were uninfected or were infected i.p. on day 0 with 2 × 10⁴ PFU LCMV Armstrong strain, and spleens were harvested and processed on day 8. CD8 populations positive for binding Db tetramers complexed with LCMV peptides NP396-404 (NP396) or GP33-41 (GP33) were assessed by flow cytometric analysis. Dot plots (A) of CD8 versus tetramer fluorescence intensity are shown. Circles identify areas of CD8 T cells binding complexed tetramers. Numbers given in corners of dot plots indicate the percent of CD8 T cells that are tetramer positive for the individual sample. Averages of proportions (B) and numbers (C) of CD8 T cells that are tetramer positive for uninfected (open bars) and day 8 LCMV infected (closed bars) shown are for three mice per group, ± SEM. Results are representative of two repetitive experiments. *Infected samples are significantly different relative to uninfected samples, P ≤ 0.05, as determined by a two-tailed Student's t test. Broken lines across graphs in B and C signify basal staining of cells from uninfected mice.
Figure 4
Figure 4
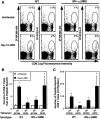
LCMV epitope-specific stimulation of CD8 T cell IFN-γ expression in cells from IFN-α/βR KO mice. WT and IFN-α/βR KO mice were infected i.p. on day 0 with 2 × 10⁴ PFU LCMV Armstrong strain. On day 8 after infection, spleens were harvested and processed. Splenic leukocytes were stimulated in the presence or absence of the immunodominant LCMV peptides NP396-404 or GP33-41, or anti–CD3, and labeled for flow cytometric analysis of cytoplasmic IFN-γ protein in CD8 T cells, as described in Materials and Methods. Dot plots (A) display CD8 versus IFN-γ fluorescence intensity, with CD8 T cells expressing IFN-γ circled. Numbers given in corners of dot plots are proportions of CD8 T cells expressing cytoplasmic IFN-γ for the individual samples. Averages of proportions (B) and numbers (C) of CD8 T cells positive for IFN-γ expression are shown for three mice per group, ± SEM. Results are representative of two repetitive experiments.
Figure 5
Figure 5
LCMV viral titers in IFN-α/βR KO as compared with WT mice. WT (○) and IFN-α/βR KO (•) mice were infected on day 0 with 2 × 10⁴ PFU LCMV Armstrong strain. Spleens and livers were harvested on 1.5, 3, 4.5, 7, 8, 9.5, 11, 14, 21, 28, or 35 d after infection, for quantitation of LCMV titers in plaque assays. Data shown are means for three mice per group ± SEM, and the solid lines across the graphs represent the lower limits of detection.
Figure 6
Figure 6
IL-12 p70 induction during LCMV infections of IFN-α/βR KO mice. Serum samples taken from WT (open bars) and IFN-α/βR KO (closed bars) mice that were either uninfected or infected for 1.5, 3, 4.5, 7, 8, or 9.5 d with 2 × 10⁴ PFU LCMV Armstrong strain. A capture biological assay was used to measure IL-12 p70 levels. Values shown are means of two to three mice per group, ± SEM. Solid line across graph indicates limit of detection for the assay.
Figure 7
Figure 7
T cell responses in mice lacking endogenous function of both IL-12 and IFN-α/β. Mice, WT and IFN-α/βR KO 129 (A) or WT and IL-12p35 KO 129/B6 (B), were infected i.p. on day 0 with 2 × 10⁴ PFU LCMV Armstrong strain. The WT and IFN-α/βR KO 129 mice received either control or neutralizing C17.8 anti–IL-12p40 antibodies. The WT and IL-12p35 KO 129/B6 mice received either control or polyclonal neutralizing anti–IFN-α/β antibodies. All antibody treatments were given i.p. on days −1 and 4 relative to infection. On day 8 after infection, blood and spleens were harvested and processed. Levels of IFN-γ in splenic leukocyte CM and serum samples were measured by ELISA. Hatched bars represent samples from mice with antibody-mediated neutralization of cytokine functions. Data shown are means ± SEM. Significantly different P values were calculated by a two-tailed Student's t test comparing either anticytokine- to control-treated mutant mice (*,**) or anticytokine-treated mutant to wild-type mice (++), * P ≤ 0.05, ** P ≤ 0.01, ++P ≤ 0.01. As a result of pooling results from two repetitive experiments, the values in A represent mean results with six mice per group. Those in B represent means of results from three mice per group.
Figure 8
Figure 8
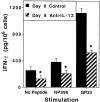
LCMV-specific IFN-γ production in mice lacking endogenous IFN-α/β function. IFN-α/βR KO mice were infected i.p. on day 0 with 2 × 10⁴ PFU LCMV Armstrong strain. They received either control (closed bars) or C17.8 anti– IL-12 (striped bars) antibodies, given i.p. on days −1 and 4 relative to infection. On day 8 after infection, spleens were harvested and processed to generate CM in the presence or absence of the immunodominant LCMV peptides NP396-404 (NP396) or GP33-41 (GP33). Levels of IFN-γ in samples were measured by ELISA. Data presented are means for three mice per group ± SEM. Significantly different (*) P values comparing anti–IL-12– to control-treated IFN-α/βR KO mice were calculated by a two-tailed Student's t test and were ≤0.05.

Similar articles

Cited by

References

    1. Biron CA, Gazzinelli RT. Effects of IL-12 on immune responses to microbial infections: a key mediator in regulating disease outcome. Curr Opin Immunol. 1995;7:485–496. - PubMed
    1. Medzhitov R, Janeway CA. Innate immunity: impact on the adaptive immune response. Curr Opin Immunol. 1997;9:4–9. - PubMed
    1. Heinzel FP, Rerko RM, Ling P, Hakimi J, Schoenhaut DS. Interleukin 12 is produced in vivo during endotoxemia and stimulates synthesis of gamma interferon. Infect Immunol. 1994;62:4244–4249. - PMC - PubMed
    1. Hsieh C-S, Macetionia SE, Tripp CS, Wolf SF, O'Garra A, Murphy KM. Development of Th1 CD4+ T cells through IL-12 produced by Listeria-induced macrophages. Science. 1993;260:547–549. - PubMed
    1. Manetti R, Parronchi P, Giudizi MG, Piccinni MP, Maggi E, Trinchieri G, Romagnani S. Natural killer cell stimulatory factor (interleukin 12 [IL-12]) induces T helper type 1 (Th1)–specific immune responses and inhibits the development of IL-4-producing Th cells. J Exp Med. 1993;177:1199–1204. - PMC - PubMed

Publication types