Interpreting patterns of gene expression with self-organizing maps: methods and application to hematopoietic differentiation
- PMID: 10077610
- PMCID: PMC15868
- DOI: 10.1073/pnas.96.6.2907
Interpreting patterns of gene expression with self-organizing maps: methods and application to hematopoietic differentiation
Abstract
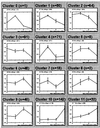
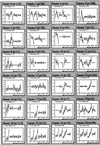
Array technologies have made it straightforward to monitor simultaneously the expression pattern of thousands of genes. The challenge now is to interpret such massive data sets. The first step is to extract the fundamental patterns of gene expression inherent in the data. This paper describes the application of self-organizing maps, a type of mathematical cluster analysis that is particularly well suited for recognizing and classifying features in complex, multidimensional data. The method has been implemented in a publicly available computer package, GENECLUSTER, that performs the analytical calculations and provides easy data visualization. To illustrate the value of such analysis, the approach is applied to hematopoietic differentiation in four well studied models (HL-60, U937, Jurkat, and NB4 cells). Expression patterns of some 6,000 human genes were assayed, and an online database was created. GENECLUSTER was used to organize the genes into biologically relevant clusters that suggest novel hypotheses about hematopoietic differentiation-for example, highlighting certain genes and pathways involved in "differentiation therapy" used in the treatment of acute promyelocytic leukemia.
Figures


Similar articles
-
Improving cluster visualization in self-organizing maps: application in gene expression data analysis.Comput Biol Med. 2007 Dec;37(12):1677-89. doi: 10.1016/j.compbiomed.2007.04.003. Epub 2007 Jun 4. Comput Biol Med. 2007. PMID: 17544390
-
Clustering gene expression data using adaptive double self-organizing map.Physiol Genomics. 2003 Jun 24;14(1):35-46. doi: 10.1152/physiolgenomics.00138.2002. Physiol Genomics. 2003. PMID: 12672901
-
Co-clustering and visualization of gene expression data and gene ontology terms for Saccharomyces cerevisiae using self-organizing maps.J Biomed Inform. 2007 Apr;40(2):160-73. doi: 10.1016/j.jbi.2006.05.001. Epub 2006 May 20. J Biomed Inform. 2007. PMID: 16824804
-
Differentiation primary response genes and proto-oncogenes as positive and negative regulators of terminal hematopoietic cell differentiation.Stem Cells. 1994 Jul;12(4):352-69. doi: 10.1002/stem.5530120402. Stem Cells. 1994. PMID: 7951003 Review.
-
Engineering Aspects of Olfaction.In: Persaud KC, Marco S, Gutiérrez-Gálvez A, editors. Neuromorphic Olfaction. Boca Raton (FL): CRC Press/Taylor & Francis; 2013. Chapter 1. In: Persaud KC, Marco S, Gutiérrez-Gálvez A, editors. Neuromorphic Olfaction. Boca Raton (FL): CRC Press/Taylor & Francis; 2013. Chapter 1. PMID: 26042329 Free Books & Documents. Review.
Cited by
-
Mapping of redox state of mitochondrial cytochromes in live cardiomyocytes using Raman microspectroscopy.PLoS One. 2012;7(9):e41990. doi: 10.1371/journal.pone.0041990. Epub 2012 Sep 5. PLoS One. 2012. PMID: 22957018 Free PMC article.
-
Signal oscillation is another reason for variability in microarray-based gene expression quantification.PLoS One. 2013;8(1):e54753. doi: 10.1371/journal.pone.0054753. Epub 2013 Jan 21. PLoS One. 2013. PMID: 23349963 Free PMC article.
-
An update on the strategies in multicomponent activity monitoring within the phytopharmaceutical field.BMC Complement Altern Med. 2012 Mar 14;12:18. doi: 10.1186/1472-6882-12-18. BMC Complement Altern Med. 2012. PMID: 22417247 Free PMC article.
-
Viscoelastic properties of differentiating blood cells are fate- and function-dependent.PLoS One. 2012;7(9):e45237. doi: 10.1371/journal.pone.0045237. Epub 2012 Sep 27. PLoS One. 2012. PMID: 23028868 Free PMC article.
-
Use of a bovine genome chip to identify new biological pathways for beef quality in cattle.Mol Biol Rep. 2012 Dec;39(12):10979-86. doi: 10.1007/s11033-012-1999-8. Epub 2012 Oct 8. Mol Biol Rep. 2012. PMID: 23053987
References
-
- Lockhart D J, Dong H, Byrne M C, Follettie M T, Gallo M V, Chee M, Mittmann M, Wang C, Kobayashi M, Horton, et al. Nat Biotechnol. 1996;14:1675–1680. - PubMed
-
- De Risi J, Iyer V, Brown P. Science. 1997;278:680–686. - PubMed
-
- Wodicka L, Dong H, Mittmann M, Ho M, Lockhart D. Nat Biotechnol. 1997;15:1359–1367. - PubMed
-
- Cho R J, Campbell J J, Winzeler E A, Steinmetz L, Conway A, Wodicka L, Wolfsberg T G, Gabrielian A E, Landsman D, Lockart D J, et al. Mol Cell. 1998;2:65–73. - PubMed
-
- Chu S, DeRisi J, Eisen M, Mulholland J, Botstein D, Brown P O, Herskowitz I. Science. 1998;282:699–705. - PubMed
Publication types
MeSH terms
LinkOut - more resources
Full Text Sources
Other Literature Sources

