. 1999 Jan 1;19(1):274-87.
doi: 10.1523/JNEUROSCI.19-01-00274.1999.

Oscillatory coupling of hippocampal pyramidal cells and interneurons in the behaving Rat

Affiliations

Oscillatory coupling of hippocampal pyramidal cells and interneurons in the behaving Rat

J Csicsvari et al. J Neurosci. .

Abstract

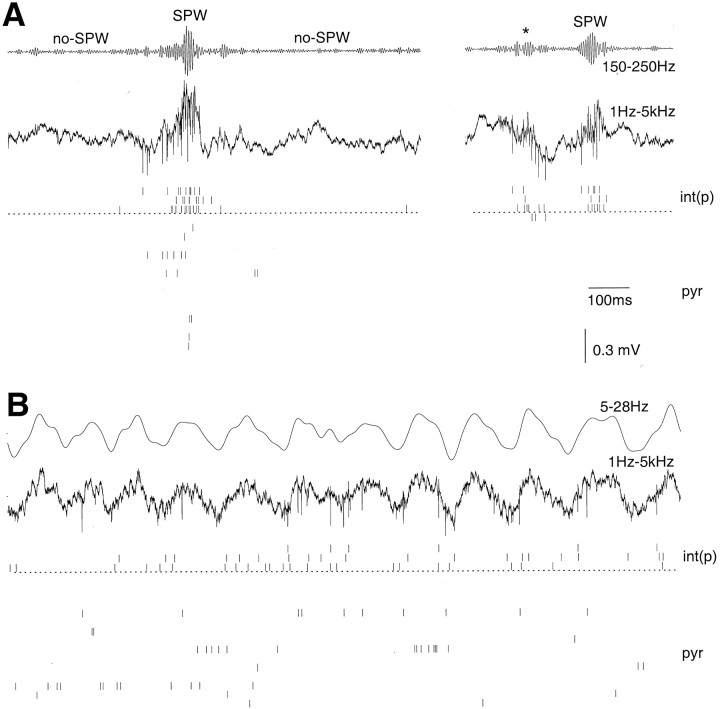
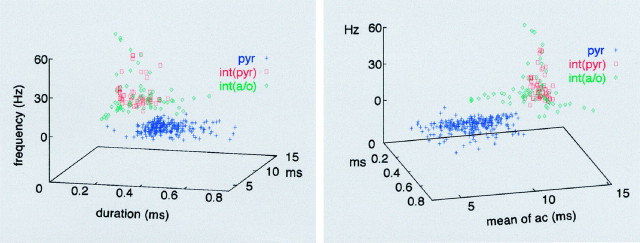
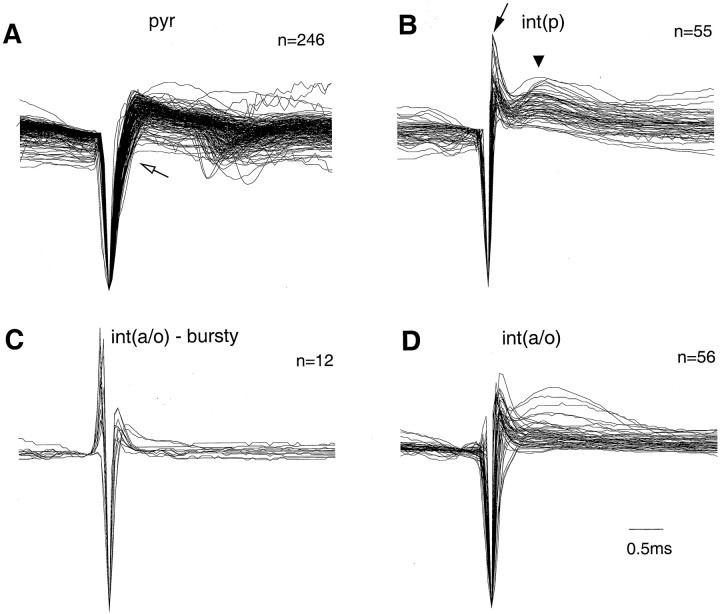
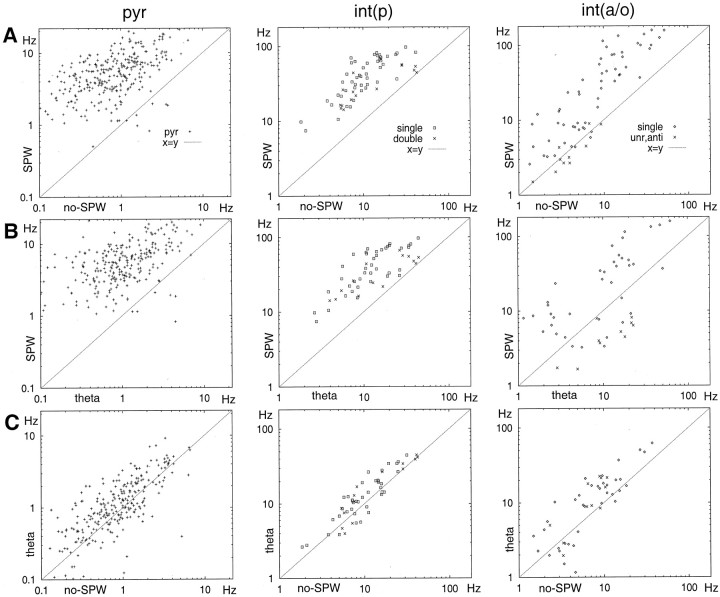
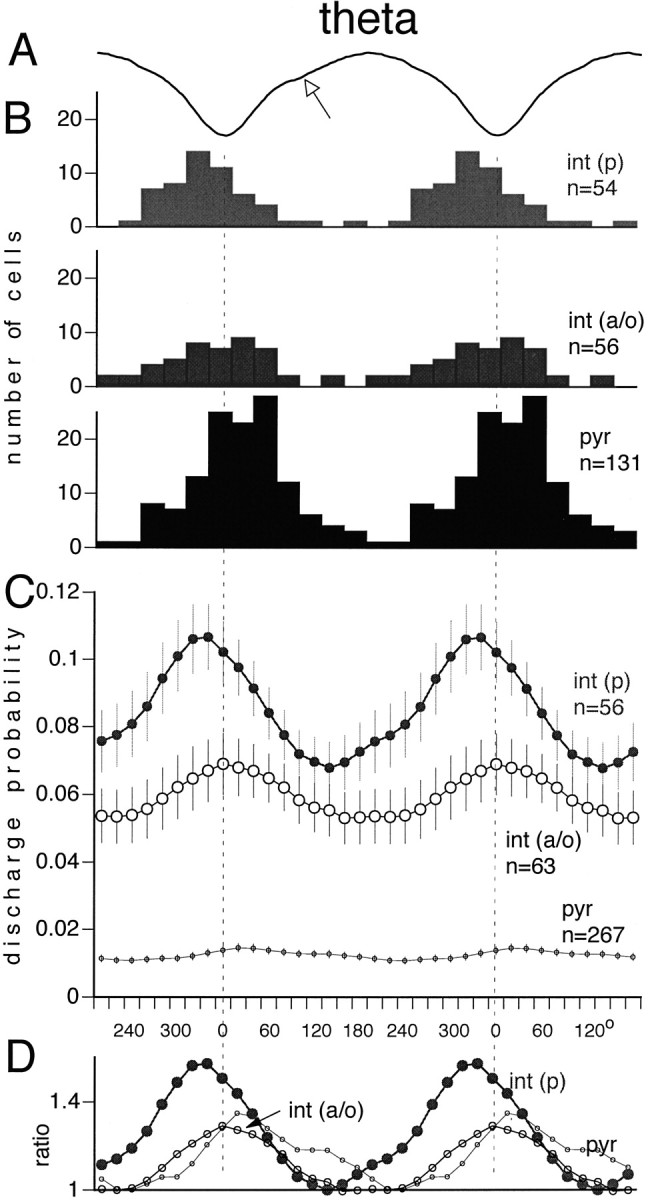
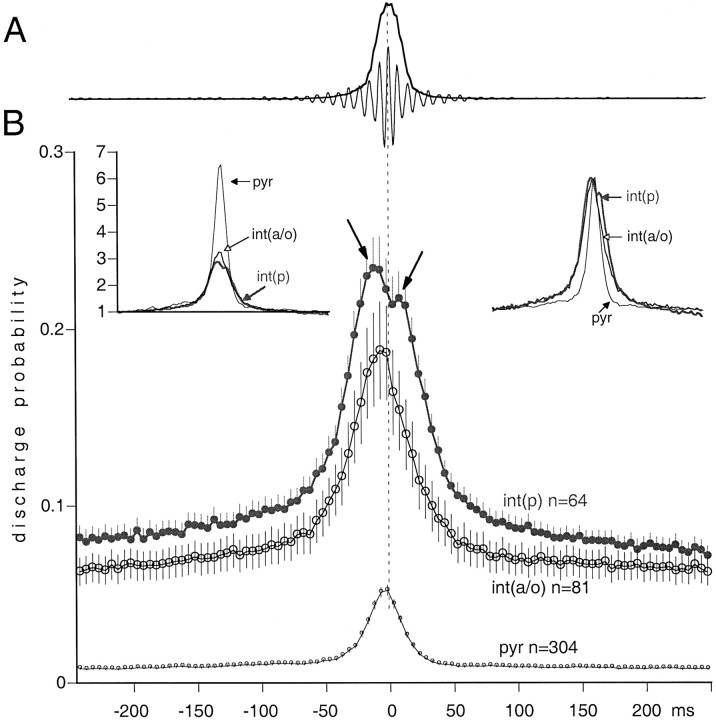
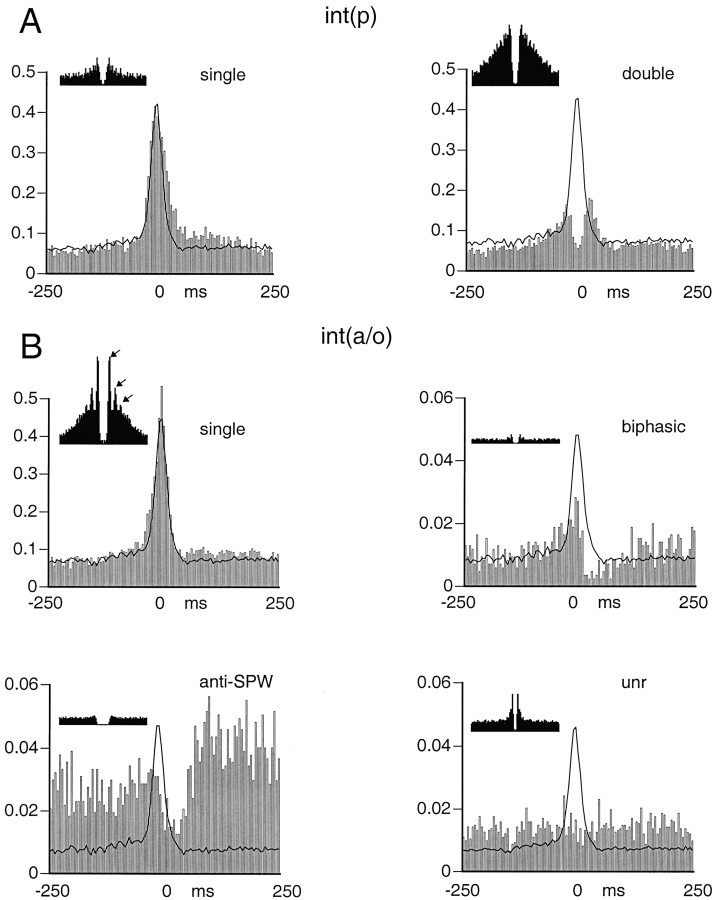
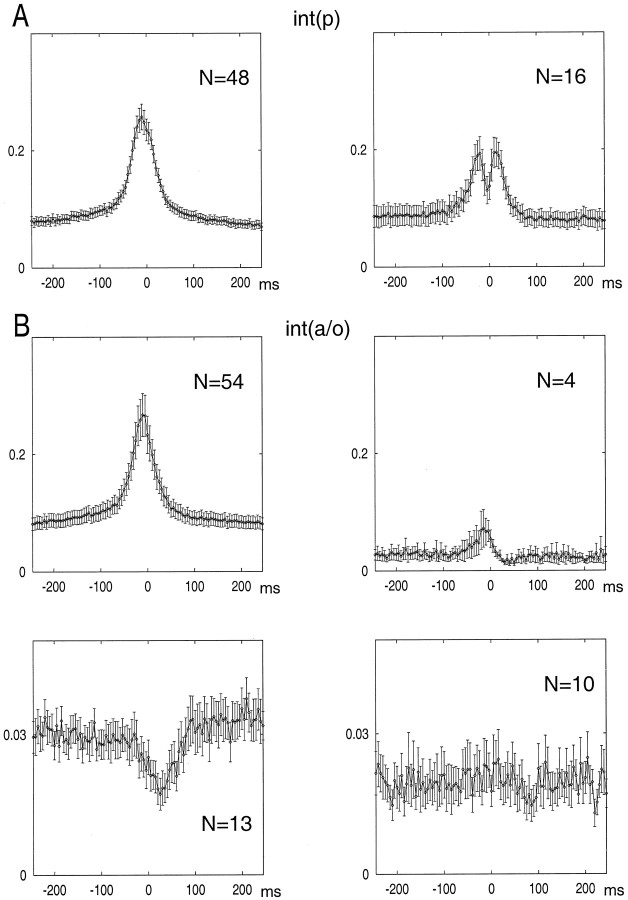
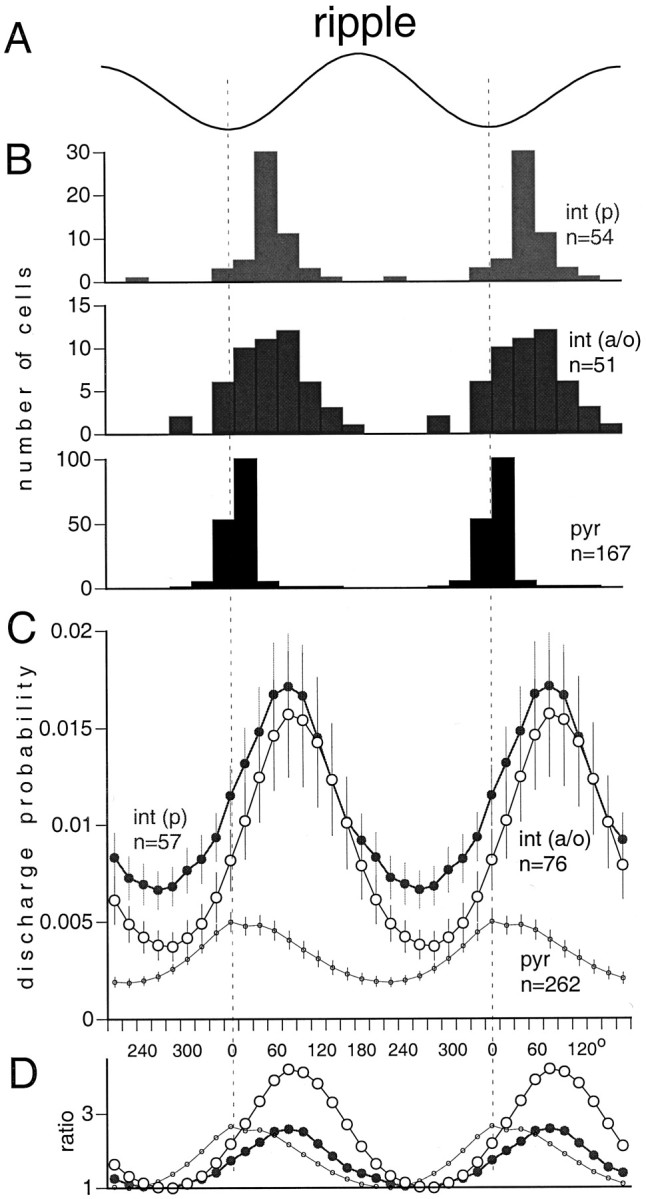
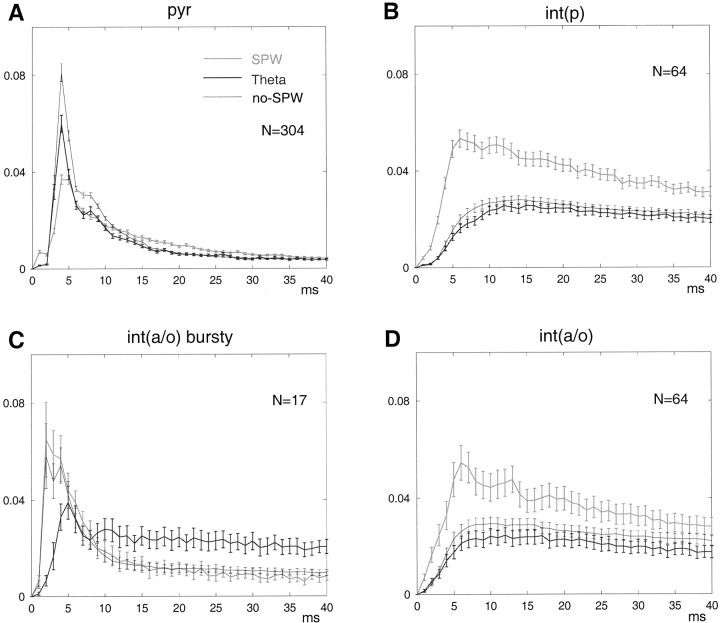
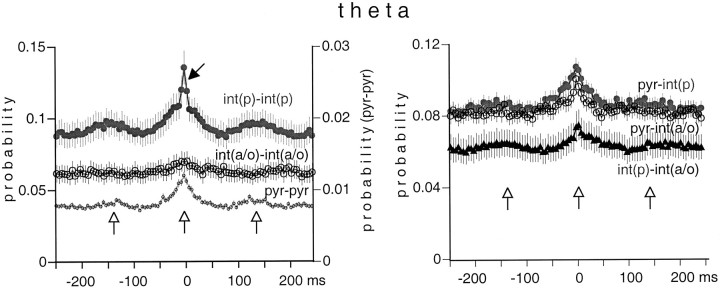
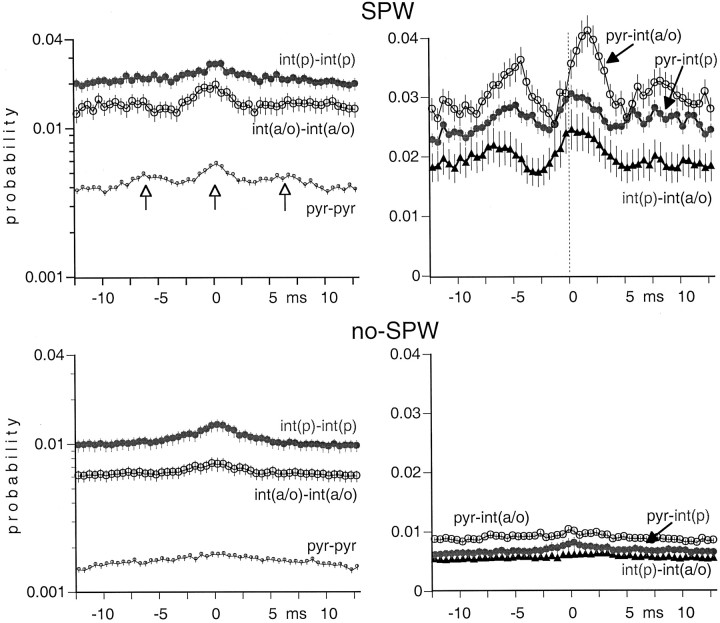
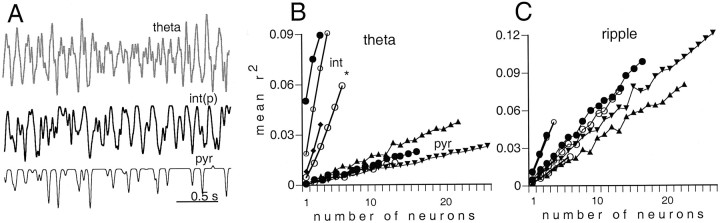
We examined whether excitation and inhibition are balanced in hippocampal cortical networks. Extracellular field and single-unit activity were recorded by multiple tetrodes and multisite silicon probes to reveal the timing of the activity of hippocampal CA1 pyramidal cells and classes of interneurons during theta waves and sharp wave burst (SPW)-associated field ripples. The somatic and dendritic inhibition of pyramidal cells was deduced from the activity of interneurons in the pyramidal layer [int(p)] and in the alveus and st. oriens [int(a/o)], respectively. Int(p) and int(a/o) discharged an average of 60 and 20 degrees before the population discharge of pyramidal cells during the theta cycle, respectively. SPW ripples were associated with a 2.5-fold net increase of excitation. The discharge frequency of int(a/o) increased, decreased ("anti-SPW" cells), or did not change ("SPW-independent" cells) during SPW, suggesting that not all interneurons are innervated by pyramidal cells. Int(p) either fired together with (unimodal cells) or both before and after (bimodal cells) the pyramidal cell burst. During fast-ripple oscillation, the activity of interneurons in both the int(p) and int(a/o) groups lagged the maximum discharge probability of pyramidal neurons by 1-2 msec. Network state changes, as reflected by field activity, covaried with changes in the spike train dynamics of single cells and their interactions. Summed activity of parallel-recorded interneurons, but not of pyramidal cells, reliably predicted theta cycles, whereas the reverse was true for the ripple cycles of SPWs. We suggest that network-driven excitability changes provide temporal windows of opportunity for single pyramidal cells to suppress, enable, or facilitate selective synaptic inputs.


Figures

Fig. 1.
Fig. 1.
Parallel recorded of interneurons and pyramidal cells in the CA1 pyramidal layer. A, Two epochs during slow-wave sleep. B, REM sleep. A, B, Traces, Filtered (upper) and wide-band (lower) traces recorded from one of the tetrodes. Vertical ticks, Action potentials of isolated neurons. Note the clustering of action potentials during sharp wave (SPW)-associated field ripples and the relative paucity of cell discharge between sharp waves (no-SPW). A, Right, A rare case without concomitant pyramidal cell discharge during SPW ripple. Asterisk, Small size ripple. Epochs like this were excluded from the analysis (see Materials and Methods). Positivity is up in this and all subsequent figures. int(p), Three interneurons in the CA1 pyramidal layer; pyr, 15 pyramidal cells recorded by four tetrodes.
Fig. 2.
Fig. 2.
Physiological identification of pyramidal cells and interneurons by extracellular recording. Three independent parameters of extracellular spikes are plotted in the three-dimensional space. x-axis, Duration of the extracellular spike (filtered at 1 Hz and 5 kHz) measured at 25% of spike amplitude.y-axis, The first moment (mean) of the spike autocorrelogram (ac). z-axis, Firing rate. Two views are shown. Note the clear separation of thepyr from the interneuron clusters. Note also the tight cluster formed by int(p). int(a/o), Interneurons recorded in the alveus and stratum oriens.
Fig. 3.
Fig. 3.
Waveform differences of pyramidal cells and interneurons. Superimposed average traces of all pyramidal cells and putative interneurons. The waveforms (averages ofn > 200 individual spikes) were amplitude normalized for this display. Filters settings were 1 Hz and 5 kHz.A, Note the wider negative spike component ofpyr and a change in slope of the ascending phase (open arrow). B, Note also the uniform waveforms of the putative int(p). The sharp positive spike (filled arrow) usually is followed by another positive component at 0.8 msec (triangle).C, D, Putative int(a/o)displayed more variability. Waveforms of cells with fast (>250 Hz) bursts (see Fig. 10C) are shown separately (bursty). Note that in most bursty cells the waveform is characterized by an early positive component.
Fig. 4.
Fig. 4.
Comparison of the discharge frequency of individual neurons during different behavioral states. SPWs were associated with a large increase in firing rate in all groups. Interneurons were subdivided further according to their histograms during SPW as “SPW-unrelated” (unr), anti-SWP (anti), and single peak neurons (see Figs. 7, 8). There was no obvious difference in firing rate between single-peak (single) and double-peak (double) int(p) interneurons (see Fig. 8).
Fig. 5.
Fig. 5.
Theta phase modulation of pyr,int(p), and int(a/o). A, Averaged field theta wave. Two theta cycles are shown to facilitate phase comparison with unit discharges. The arrowindicates a “notch” in the waveform, typical in the theta wave of strata oriens and pyramidale. B, Phase distribution of single cells relative to the negative peak of the locally recorded theta waves (dashed vertical lines). The peak of the theta phase histogram was used to determine the preferred phase of a single cell. Only neurons with significant phase modulation are shown (see Materials and Methods). C, Average discharge probability of the neuronal subgroups (mean ± SE). All neurons are included, independent of whether their cross-correlograms showed a significant modulation with theta waves or not. Note thatint(p) preceded pyramidal neurons by ∼60°.D, Normalized probabilities of the different cell groups (depth of theta modulation). The lowest probability value during the theta cycle was regarded as the baseline for each neuronal type, and the probabilities were divided by this value. Note that the strongest inhibition occurs before the highest probability of pyramidal cell discharge.
Fig. 6.
Fig. 6.
Discharge probability of pyr,int(p), and int(a/o) during hippocampal SPW-associated ripples. A, Averaged field ripple wave (thin line) and integrated, squared sum of the ripple (thick line). Neuronal discharges were aligned to the peak of the integrated ripple (time 0).B, Averaged discharge probability of the neuronal subgroups (mean ± SE). Left inset, Normalized probabilities. Each point of the probability curve was divided by the baseline discharge probability (averages of points between −250 and −200 msec). Note the 2.5-fold increase of discharge probability of pyramidal cells relative to that of interneurons during the peak of the ripple. Right inset, The probability distributions of the three groups shown at the same relative scale (0–100%). Note the earlier and longer-lasting discharge of interneurons relative to pyramidal cells.
Fig. 7.
Fig. 7.
Subsets of interneurons show different ripple-associated firing patterns. Single-cell examples are shown.A, Discharge probabilities of singleint(p). B, Discharge probabilities ofint(a/o). Time 0 (reference) corresponds to the peak of the ripple (see Fig. 6). Continuous lines, Averaged discharge probability of simultaneously recorded pyramidal neurons (n = 11–26).Insets, Autocorrelograms of spike times;x-axis, 100 msec. A,Single, Interneuron with single peak.Double, Interneuron with double peaks before and after the maximum activity of pyramidal cells. B,Single, Int(a/o) interneuron with single peak. Note several peaks (arrows) in the autocorrelogram, corresponding to ripple frequency.Biphasic, Interneuron with a small peak and suppression of neuronal discharge after the maximum activity of pyramidal cells.Anti-SPW, Anti-SPW interneuron. Note the suppression of discharge after the maximum activity of pyramidal cells.
Fig. 8.
Fig. 8.
Group data for the interneuron types shown in Figure 5. A, Int(p) had either a single peak (left) or double peaks (right) before and after the maximum discharge probability of pyramidal cells.B, Most int(a/o) had a single peak (upper left), whereas others were either suppressed after the population discharge of pyramidal cells (lower left; anti-SPW cells) or were not affected by the SPW burst (lower right; SPW-independent cells). A few cells had a significant suppression after an initial excitation (upper right).
Fig. 9.
Fig. 9.
Ripple phase modulation of pyr,int(p), and int(a/o). A, Averaged field ripple wave (two cycles shown). B, Phase distribution of single cells relative to the negative peak of the ripple waves (dashed vertical lines). The peak of the phase-corrected cross-correlogram between cell discharge and ripple was used to determine the preferred phase of a single cell. Only neurons with significant ripple phase modulation are shown. C, Averaged discharge probability of the neuronal subgroups (mean ± SE). All neurons are included, independent of whether their cross-correlograms showed a significant modulation with the ripple waves or not. D, Normalized probabilities of the different cell groups (depth of ripple modulation). The lowest probability value during the ripple cycle was regarded as the baseline for each neuronal type, and the probabilities were divided by this figure. Note that interneurons follow pyramidal neurons by 90° (∼1.2 msec for a 200 Hz ripple).
Fig. 10.
Fig. 10.
State-dependent discharge patterns inpyr (A), int(p)(B), and int(a/o)(C, D). Autocorrelograms were calculated for each network state (theta, SPW, andno-SPW). A, Note the large, sharp peaks at <5 msec, indicating complex-spike bursts of pyramidal cells.B, D, Note also peaks during SPW at 6 msec in int(p) (B) and mostint(a/o) (D) interneurons.C, A subgroup of int(a/o) displayed high frequency (>300 Hz) burst discharges.
Fig. 11.
Fig. 11.
Averaged cross-correlograms of cell pairs during theta oscillation. Note the rhythmic peaks in the cross-correlograms ofint(p)int(p) andpyrpyr pairs (left) andint(p)int(a/o) pairs (right) at theta frequency (vertical open arrows). The narrow peak in theint(p)int(p) histogram (left) reflects a prominent gamma frequency oscillation of these neurons (black arrow).
Fig. 12.
Fig. 12.
Averaged cross-correlograms of cell pairs during SPW bursts and between SPW events (no-SPW). Note the rhythmic peaks in the histogram of pyramidal neurons (vertical open arrows). Note also the time-shifted peaks of pyrint(a/o) pairs. The discharge probabilities during no-SPW epochs were low for each group.
Fig. 13.
Fig. 13.
Correlation between field activity and population discharge of neurons. A, A short segment of theta activity (theta) and summed activity of 3int(p) and 16 pyr. Note the similarity between theta field and summed interneuron activity. B, The square of the mean correlation coefficients between unit activity and theta plotted as a function of the number of simultaneously recorded neurons. Note that interneurons (int) showed a more reliable relationship with theta than did pyramidal cells.Asterisk, Three of the six interneurons recorded from the alveus and st. oriens. C, The square of the mean correlation coefficients between unit activity and ripple cycles plotted as a function of the number of simultaneously recorded neurons during ripple. Note that pyramidal cell ensembles predict ripples more reliably than theta, but the reverse is true for interneurons.

Similar articles

Cited by

References

    1. Abeles M. Local cortical circuits: an electrophysiological study. Springer; Berlin: 1982.
    1. Abeles M, Goldstein MH. Multispike train analysis. Proc IEEE. 1977;65:762–773.
    1. Ali AB, Deuchars J, Pawelzi H, Thomson A. CA1 pyramidal to basket and bistratified EPSPs: dual intracellular recordings in rat hippocampal slices. J Physiol (Lond) 1998;507:201–217. - PMC - PubMed
    1. Bair W, Koch C. Temporal precision of spike trains in extrastriate cortex of the behaving macaque monkey. Neural Comput. 1996;8:1185–1202. - PubMed
    1. Bankman IN, Johnson KO, Schneide W. Optimal detection, classification, and superposition resolution in neural waveform recordings. IEEE Trans Biomed Eng. 1993;40:836–841. - PubMed

Publication types

LinkOut - more resources