The barrier-to-autointegration protein is a host factor for HIV type 1 integration
- PMID: 9860958
- PMCID: PMC28032
- DOI: 10.1073/pnas.95.26.15270
The barrier-to-autointegration protein is a host factor for HIV type 1 integration
Abstract
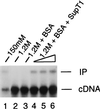
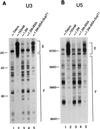
In vivo, retroviral integration is mediated by a large nucleoprotein complex, termed the preintegration complex (PIC). PICs isolated from infected cells display in vitro integration activity. Here, we analyze the roles of different host cell factors in the structure and function of HIV type 1 (HIV-1) PICs. PICs purified by size exclusion after treatment with high salt lost their integration activity, and adding back an extract from uninfected cells restored this activity. In parallel, the native protein-DNA intasome structure detected at the ends of HIV-1 by Mu-mediated PCR footprinting was abolished by high salt and restored by the crude cell extract. Various purified proteins previously implicated in retroviral PIC function then were analyzed for their effects on the structure and function of salt-treated HIV-1 PICs. Whereas relatively low amounts (5-20 nM) of human barrier-to-autointegration factor (BAF) protein restored integration activity, substantially more (5-10 microM) human host factor HMG I(Y) was required. Similarly high levels (3-8 microM) of bovine RNase A, a DNA-binding protein used as a nonspecific control, also restored activity. Mu-mediated PCR footprinting revealed that of these three purified proteins, only BAF restored the native structure of the HIV-1 protein-DNA intasome. We suggest that BAF is a natural host cofactor for HIV-1 integration.
Figures


Similar articles
-
The barrier-to-autointegration factor is a component of functional human immunodeficiency virus type 1 preintegration complexes.J Virol. 2003 Apr;77(8):5030-6. doi: 10.1128/jvi.77.8.5030-5036.2003. J Virol. 2003. PMID: 12663813 Free PMC article.
-
Modulation of activity of Moloney murine leukemia virus preintegration complexes by host factors in vitro.J Virol. 1998 Mar;72(3):2125-31. doi: 10.1128/JVI.72.3.2125-2131.1998. J Virol. 1998. PMID: 9499068 Free PMC article.
-
Barrier-to-autointegration factor BAF binds p55 Gag and matrix and is a host component of human immunodeficiency virus type 1 virions.J Virol. 2003 Dec;77(24):13084-92. doi: 10.1128/jvi.77.24.13084-13092.2003. J Virol. 2003. PMID: 14645565 Free PMC article.
-
BAF: roles in chromatin, nuclear structure and retrovirus integration.Trends Cell Biol. 2004 May;14(5):261-6. doi: 10.1016/j.tcb.2004.03.004. Trends Cell Biol. 2004. PMID: 15130582 Review.
-
Minor groove-binding architectural proteins: structure, function, and DNA recognition.Annu Rev Biophys Biomol Struct. 1998;27:105-31. doi: 10.1146/annurev.biophys.27.1.105. Annu Rev Biophys Biomol Struct. 1998. PMID: 9646864 Free PMC article. Review.
Cited by
-
Isolation of cell lines that show novel, murine leukemia virus-specific blocks to early steps of retroviral replication.J Virol. 2005 Oct;79(20):12969-78. doi: 10.1128/JVI.79.20.12969-12978.2005. J Virol. 2005. PMID: 16188999 Free PMC article.
-
Identification of host proteins associated with HIV-1 preintegration complexes isolated from infected CD4+ cells.Retrovirology. 2010 Aug 11;7:66. doi: 10.1186/1742-4690-7-66. Retrovirology. 2010. PMID: 20698996 Free PMC article.
-
Mouse mammary tumor virus integration site selection in human and mouse genomes.J Virol. 2008 Feb;82(3):1360-7. doi: 10.1128/JVI.02098-07. Epub 2007 Nov 21. J Virol. 2008. PMID: 18032509 Free PMC article.
-
Peptide HIV-1 integrase inhibitors from HIV-1 gene products.J Med Chem. 2010 Jul 22;53(14):5356-60. doi: 10.1021/jm1003528. J Med Chem. 2010. PMID: 20586421 Free PMC article.
-
Regulatory mechanisms by which barrier-to-autointegration factor blocks autointegration and stimulates intermolecular integration of Moloney murine leukemia virus preintegration complexes.J Virol. 2002 Dec;76(23):12376-80. doi: 10.1128/jvi.76.23.12376-12380.2002. J Virol. 2002. PMID: 12414981 Free PMC article.
References
Publication types
MeSH terms
Substances
Grants and funding
LinkOut - more resources
Full Text Sources
Other Literature Sources
Research Materials

