. 1998 Dec 15;18(24):10464-72.
doi: 10.1523/JNEUROSCI.18-24-10464.1998.

Synaptic modifications in cultured hippocampal neurons: dependence on spike timing, synaptic strength, and postsynaptic cell type

Affiliations

Synaptic modifications in cultured hippocampal neurons: dependence on spike timing, synaptic strength, and postsynaptic cell type

G Q Bi et al. J Neurosci. .

Abstract

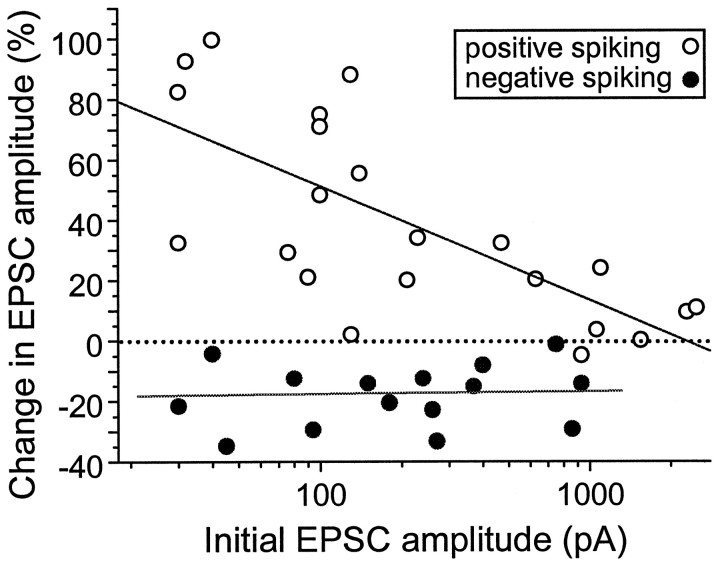
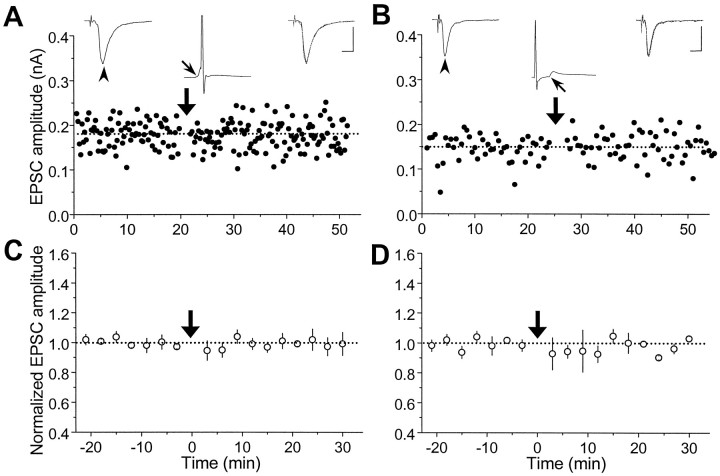
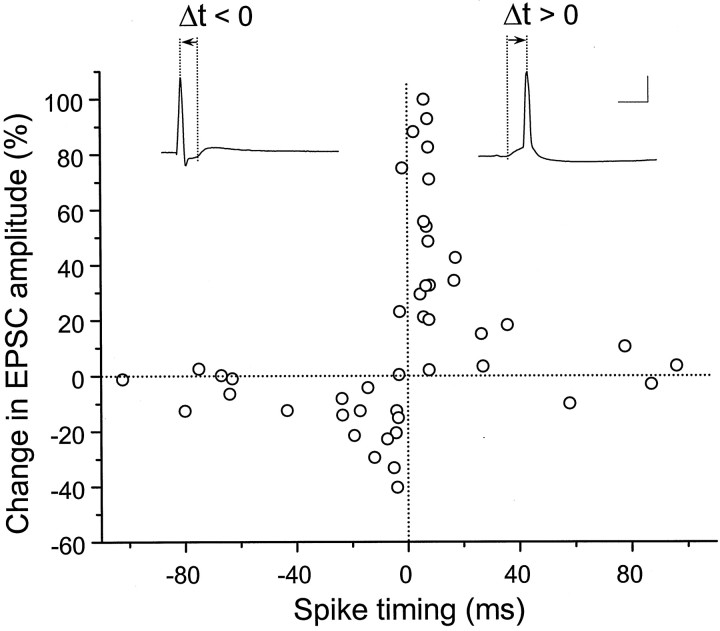
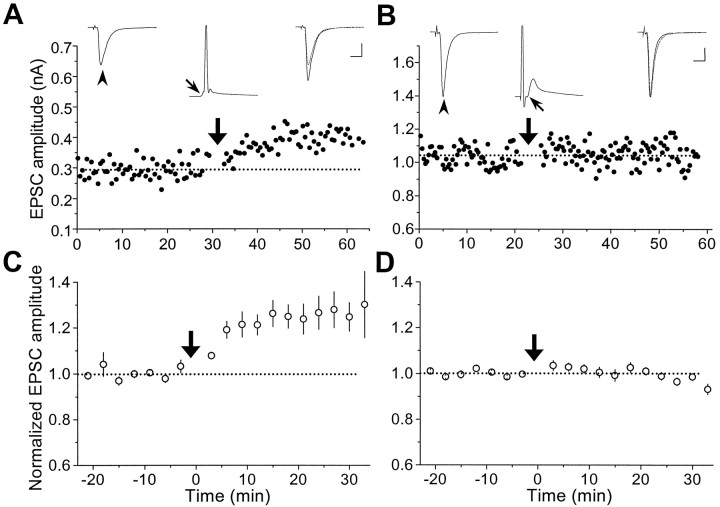
In cultures of dissociated rat hippocampal neurons, persistent potentiation and depression of glutamatergic synapses were induced by correlated spiking of presynaptic and postsynaptic neurons. The relative timing between the presynaptic and postsynaptic spiking determined the direction and the extent of synaptic changes. Repetitive postsynaptic spiking within a time window of 20 msec after presynaptic activation resulted in long-term potentiation (LTP), whereas postsynaptic spiking within a window of 20 msec before the repetitive presynaptic activation led to long-term depression (LTD). Significant LTP occurred only at synapses with relatively low initial strength, whereas the extent of LTD did not show obvious dependence on the initial synaptic strength. Both LTP and LTD depended on the activation of NMDA receptors and were absent in cases in which the postsynaptic neurons were GABAergic in nature. Blockade of L-type calcium channels with nimodipine abolished the induction of LTD and reduced the extent of LTP. These results underscore the importance of precise spike timing, synaptic strength, and postsynaptic cell type in the activity-induced modification of central synapses and suggest that Hebb's rule may need to incorporate a quantitative consideration of spike timing that reflects the narrow and asymmetric window for the induction of synaptic modification.


Figures

Fig. 1.
Fig. 1.
Glutamatergic and GABAergic connections between two hippocampal neurons in cell cultures. A, Synaptic currents recorded from a pair of interconnected glutamatergic neurons. Step depolarizations (+ 100 mV, 1 msec) were applied sequentially to each neuron while EPSCs were monitored in both neurons (Vc = −70 mV). The matrices depict sample EPSCs recorded in either neuron (R1 orR2) when neuron 1 (S1) and neuron 2 (S2) were stimulated sequentially (average of 5 consecutive events). The three matrices represent synaptic and autaptic currents before and after sequential addition of bicuculline (10 μm) and CNQX (10 μm) into the culture.Arrowheads indicate monosynaptic EPSCs that were the focus of the present study. Calibration: 100 pA, 10 msec.B, Synaptic currents recorded from one glutamatergic neuron (R1) and an interconnecting GABAergic neuron (R2). Stimulating the latter (S2) results in IPSCs (marked by *). Three matrices represent synaptic and autaptic currents before and after sequential addition of CNQX (10 μm) and bicuculline (10 μm). Calibration: 100 pA, 10 msec.
Fig. 2.
Fig. 2.
Synaptic potentiation induced by repetitive presynaptic stimulation with “positively correlated postsynaptic spiking.” A, Results obtained from a pair of glutamatergic neurons in hippocampal culture. Data points depict the amplitude of monosynaptic EPSCs induced by test stimuli (0.03 Hz,Vc = −70 mV) before and after repetitive stimulation of the presynaptic neuron (60 pulses at 1 Hz, marked by thethick arrow), with both neurons held in current clamp. Traces of EPSCs (average of 5–10 consecutive events) 5 min before (left) and 20 min after (right) the repetitive stimulation are shown above, with the 5 min trace (dashed line) superimposed onto the latter.Arrowheads mark the EPSCs being studied. * indicates a polysynaptic EPSC. The EPSP (with its onset time marked by thethin arrow) and the spike recorded during one cycle of the repetitive stimulation are depicted by the middle trace above. Note that each presynaptic stimulus was capable of initiating an action potential that peaked at ∼5 msec after the onset of the EPSP. Calibration: 200 pA, 10 msec for EPSCs; 40 mV, 10 msec for EPSPs.B, Results obtained from another pair of glutamatergic neurons. In this case, during each cycle of repetitive stimulation, the EPSP was subthreshold, and a depolarizing current pulse (2 nA, 2 msec) was injected into the postsynaptic neuron after the presynaptic activation to induce a spike that peaked at ∼5 msec after the onset of the EPSP. Calibration: 20 pA, 10 msec for EPSCs; 20 mV, 10 msec for EPSPs. C, Summary of all experiments with positively correlated postsynaptic spiking similar to that described inA and B in the absence (○,n = 14) or presence (•, n = 5) of d-AP-5 (25 μm). Data from all synaptic connections with initial EPSC amplitude smaller than 500 pA were included in the analysis. The amplitude of EPSCs from each experiment was grouped with a 3 min bin size and normalized to the mean value (dotted line) recorded before the repetitive stimulation. Data points represent mean ± SEM. The mean percentage change in synaptic strength after induction was 48.4 ± 9.9% (±SEM) and −2.3 ± 4.9% (±SEM) for experiments in the absence and presence of d-AP-5, respectively. Percentage change of each experiment was calculated from the mean EPSC amplitude 20–30 min after the induction protocol. When compared with the baseline value before induction, significant potentiation was observed in the absence of d-AP-5 (p < 0.001, t test) but not in the presence ofd-AP-5 (p > 0.1,t test).
Fig. 3.
Fig. 3.
Synaptic depression induced by repetitive stimulation with “negatively correlated postsynaptic spiking” on subthreshold connections. A, Results from a pair of glutamatergic neurons that formed a subthreshold synaptic connection (similar to that in Fig. 2B). During each cycle of the repetitive stimulation (1 Hz, 60 sec, at the time marked by thearrow), a depolarizing current pulse was injected into the postsynaptic neuron to initiate an action potential that peaked at ∼6 msec before the onset of each EPSP. Calibration: 100 pA, 10 msec for EPSCs; 30 mV, 10 msec for EPSPs. B, An example of autaptic connections in which the action potential initiated by the current injection acted both presynaptically and postsynaptically. The interval between the onset of the autaptic response and the peak of the action potential was ∼5 msec. Calibration: same as in A. C, Summary of all experiments with negatively correlated postsynaptic spiking similar to that described in A and B in the absence (○,n = 12) or presence (•, n = 5) of d-AP-5 (25 μm). Data from all synaptic or autaptic connections with initial EPSC amplitude smaller than 1 nA were included in the analysis. Data points represent mean ± SEM. The mean percentage change in EPSC amplitude at 20–30 min after repetitive stimulation was −18.0 ± 3.2% (±SEM) and −2.5 ± 1.8% (±SEM) for experiments in the absence and presence ofd-AP-5, respectively. Significant depression was observed in the absence of d-AP-5 (p < 0.001, t test), but not in the presence ofd-AP-5 (p > 0.1,t test).
Fig. 4.
Fig. 4.
Effect of repetitive stimulation with negatively correlated postsynaptic spiking on suprathreshold connections.A, Results from an experiment similar to that described in Figure 3A, except that the synaptic activation was capable of initiating spiking of the postsynaptic neuron. The spike initiated by current pulse injection peaked at ∼10 msec before the onset of each EPSP during repetitive stimulation. Calibration: 100 pA, 10 msec for EPSCs; 40 mV, 10 msec for the EPSP. B, Summary of all experiments similar to that described inA. Data points represent mean ± SEM (n = 3). The mean percentage change in synaptic strength after induction was 31.9 ± 9.3% (±SEM). Significant potentiation was observed (p < 0.05,t test).
Fig. 5.
Fig. 5.
Dependence of synaptic modifications on the initial synaptic strength. The percentage change in the EPSC amplitude after the repetitive stimulation (1 Hz for 60 sec) was plotted against the initial mean amplitude of EPSCs. Open circlesrepresent data from synapses exposed to repetitive presynaptic stimulation with positively correlated postsynaptic spiking (data set includes those shown in Fig. 2C). Filled circles represent data from synapses exposed to repetitive presynaptic stimulation with negatively correlated postsynaptic spiking (data set includes those shown in Fig. 3C). Percentage changes were calculated from the average EPSC amplitude 20–30 min after the repetitive stimulation. Lines represent best fits with linear regression between the percentage change and the logarithm of initial EPSC amplitudes for positively correlated (r = −0.72, p = 0.00017) and negatively correlated (r = 0.037,p = 0.89) spiking, respectively.
Fig. 6.
Fig. 6.
Lack of synaptic modification for glutamatergic synapses onto GABAergic neurons. A, Results from an experiment performed in the same manner as that described in Figure2B except that the postsynaptic neuron was GABAergic. During each cycle of repetitive stimulation, the postsynaptic spike peaked at ∼5 msec after the onset of the EPSP. Calibration: 100 pA, 10 msec for EPSCs; 50 mV, 10 msec for EPSPs.B, Results from an experiment similar to that described in Figure 3A except that the postsynaptic neuron was GABAergic. Postsynaptic spiking was initiated 16 msec before the onset of each EPSP. Calibration: same as in A. C, D, Summary of all experiments with positively correlated (C) and negatively correlated (D) spiking similar to that described inA and B, respectively. The mean percentage change in the EPSC amplitude was −0.3 ± 3.4% (±SEM,n = 5) and −1.7 ± 2.0% (±SEM,n = 4), respectively, for C andD, indicating no significant synaptic change (p > 0.1, t test).
Fig. 7.
Fig. 7.
Critical window for the induction of synaptic potentiation and depression. The percentage change in the EPSC amplitude at 20–30 min after the repetitive correlated spiking (60 pulses at 1 Hz) was plotted against the spike timing. Spike timing was defined by the time interval (Δt) between the onset of the EPSP and the peak of the postsynaptic action potential during each cycle of repetitive stimulation, as illustrated by the traces above. For this analysis, we included only synapses with initial EPSC amplitude of <500 pA, and all EPSPs were subthreshold for data associated with negatively correlated spiking. Calibration: 50 mV, 10 msec.
Fig. 8.
Fig. 8.
Differential effects of nimodipine on the induction of LTP and LTD by correlated spiking. A, Results from an experiment similar to that shown in Figure2B except that the bath solution contained 10 μm nimodipine. During repetitive stimulation, the postsynaptic spike was initiated ∼5 msec after the onset of the EPSP. Calibration: 100 pA, 10 msec for EPSCs; 30 mV, 10 msec for EPSPs.B, Results from an experiment similar to that shown in Figure 3A except that the bath solution contained 10 μm nimodipine. During repetitive stimulation, postsynaptic spiking was initiated ∼5 msec before the onset of each EPSP. Calibration: 200 pA, 10 msec for EPSCs; 30 mV, 10 msec for EPSPs.C, Summary of experiments with positively correlated spiking similar to that in A. The mean percentage change in the EPSC amplitude was 27.3 ± 8.6% (±SEM,n = 4), which represents significant potentiation (p < 0.05, t test).D, Summary of experiments with negatively correlated spiking similar to that in B. The mean percentage change in the EPSC amplitude was −1.2 ± 1.3% (±SEM,n = 7), indicating no significant synaptic change (p > 0.2; t test).

Similar articles

Cited by

References

    1. Arancio O, Kandel ER, Hawkins RD. Activity-dependent long-term enhancement of transmitter release by presynaptic 3′,5′-cyclic GMP in cultured hippocampal neurons. Nature. 1995;376:74–80. - PubMed
    1. Bekkers JM, Stevens CF. Presynaptic mechanism for long-term potentiation in the hippocampus. Nature. 1990;346:724–729. - PubMed
    1. Bell CC, Han VZ, Sugawara Y, Grant K. Synaptic plasticity in a cerebellum-like structure depends on temporal order. Nature. 1997;387:278–281. - PubMed
    1. Bienenstock EL, Cooper LN, Munro PW. Theory for the development of neuron selectivity: orientation specificity and binocular interaction in visual cortex. J Neurosci. 1982;2:32–48. - PMC - PubMed
    1. Bliss TV, Collingridge GL. A synaptic model of memory: long-term potentiation in the hippocampus. Nature. 1993;361:31–39. - PubMed

Publication types

MeSH terms

LinkOut - more resources