. 1998 Nov 2;143(3):795-813.
doi: 10.1083/jcb.143.3.795.

Paralemmin, a prenyl-palmitoyl-anchored phosphoprotein abundant in neurons and implicated in plasma membrane dynamics and cell process formation

Affiliations

Paralemmin, a prenyl-palmitoyl-anchored phosphoprotein abundant in neurons and implicated in plasma membrane dynamics and cell process formation

C Kutzleb et al. J Cell Biol. .

Abstract

We report the identification and initial characterization of paralemmin, a putative new morphoregulatory protein associated with the plasma membrane. Paralemmin is highly expressed in the brain but also less abundantly in many other tissues and cell types. cDNAs from chicken, human, and mouse predict acidic proteins of 42 kD that display a pattern of sequence cassettes with high inter-species conservation separated by poorly conserved linker sequences. Prenylation and palmitoylation of a COOH-terminal cluster of three cysteine residues confers hydrophobicity and membrane association to paralemmin. Paralemmin is also phosphorylated, and its mRNA is differentially spliced in a tissue-specific and developmentally regulated manner. Differential splicing, lipidation, and phosphorylation contribute to electrophoretic heterogeneity that results in an array of multiple bands on Western blots, most notably in brain. Paralemmin is associated with the cytoplasmic face of the plasma membranes of postsynaptic specializations, axonal and dendritic processes and perikarya, and also appears to be associated with an intracellular vesicle pool. It does not line the neuronal plasmalemma continuously but in clusters and patches. Its molecular and morphological properties are reminiscent of GAP-43, CAP-23, and MARCKS, proteins implicated in plasma membrane dynamics. Overexpression in several cell lines shows that paralemmin concentrates at sites of plasma membrane activity such as filopodia and microspikes, and induces cell expansion and process formation. The lipidation motif is essential for this morphogenic activity. We propose a function for paralemmin in the control of cell shape, e.g., through an involvement in membrane flow or in membrane-cytoskeleton interaction.


Figures
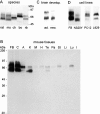
Figure 5
Figure 5
Electrophoretic heterogeneity and tissue distribution of paralemmin in Western blot analysis. (A) Brain homogenates from rat, mouse (ms), chicken (ch), cow (bo), and rabbit (rb) (30 μg protein per lane). (B) Homogenates from mouse tissues (designations as in Fig. 3; 40 μg protein per lane except A [160 μg] and M [60 μg]). (C) Brain homogenates from adult (ad.) and neonatal (neo.) mouse (10 μg protein). (D) Lysates from NS20Y (20 μg), PC12, and L929 cell lines (both, 60 μg) compared with mouse forebrain homogenate (FB, 10 μg).
Figure 3
Figure 3
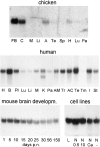
Northern blot analysis of paralemmin mRNA expression. Blots carry 10 μg poly(A)+ RNA from chicken tissues, 2 μg poly(A)+ RNA from human tissues, 20 μg total RNA from mouse brain, and 50 μg total RNA from cell lines, respectively. Tissues of origin are forebrain (FB), cerebellum (C), skeletal muscle (M), liver (Li), whole adrenal gland (A), testis (Te), spleen (Sp), heart (H), lung (Lu), pancreas (Pa), whole brain (B), placenta (Pl), kidney (K), adrenal medulla (AM), thyroid gland (Tr), adrenal cortex (AC), thymus (Tm), small intestine (I), and stomach (St). RNA from developing mouse brain was isolated on the days of postnatal age indicated. Cell lines are: (L) L929 mouse fibroblast cells; (N 0.5) NS20Y mouse neuroblastoma cells grown for 7 d at low serum (0.5%); (N 10) NS20Y cells grown for 7 d at high serum (10%); (N Ca) NS20Y cells treated with calcium ionophore A23187 for 24 h; (N −) NS20Y cells grown without A23187 for 24 h.
Figure 1
Figure 1
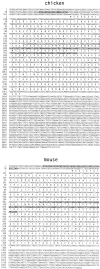
cDNA and deduced amino acid sequences of chicken and mouse paralemmin. Short reading frames in the 5′ untranslated regions and the differentially spliced sequences corresponding to human exon 8 are underlined and printed in bold. The differentially spliced chicken exon 7 sequence is underlined and italicized. The human cDNA sequence has been incorporated into the gene sequence published elsewhere (Burwinkel et al., 1998). These sequence data are available from GenBank/EMBL/ DDBJ under accession Nos. Y14769–Y14771.
Figure 2
Figure 2
(A) Alignment of the predicted amino acid sequences of chicken, human, and mouse paralemmin. The sequence subject to differential splicing of exon 8 is underlined. Candidate phosphorylation sites conserved in all three species that fit consensus sequences for protein kinase substrates are marked by the following symbols: +, casein kinase I; *, casein kinase II; ♦, protein kinase A and CaM kinase II; ○, protein kinase C; ▵, proline-directed kinases; ‖, tyrosine kinases. (References for consensus sequences: Kennelly and Krebs, 1991; Songyang et al., 1995, .) (B) Coiled-coil potential of chicken, human, and mouse paralemmin determined with the DNASTAR Protean software (Macintosh v. 3.04). (C) Alignment of the COOH-terminal amino acid sequences of paralemmin, xlgv7, and three Ras isoforms illustrating sequence motifs involved in membrane anchoring. Cysteine residues are in bold print and basic residues are underlined. Sequences are taken from Kloc et al. (1991) and references therein.
Figure 2
Figure 2
(A) Alignment of the predicted amino acid sequences of chicken, human, and mouse paralemmin. The sequence subject to differential splicing of exon 8 is underlined. Candidate phosphorylation sites conserved in all three species that fit consensus sequences for protein kinase substrates are marked by the following symbols: +, casein kinase I; *, casein kinase II; ♦, protein kinase A and CaM kinase II; ○, protein kinase C; ▵, proline-directed kinases; ‖, tyrosine kinases. (References for consensus sequences: Kennelly and Krebs, 1991; Songyang et al., 1995, .) (B) Coiled-coil potential of chicken, human, and mouse paralemmin determined with the DNASTAR Protean software (Macintosh v. 3.04). (C) Alignment of the COOH-terminal amino acid sequences of paralemmin, xlgv7, and three Ras isoforms illustrating sequence motifs involved in membrane anchoring. Cysteine residues are in bold print and basic residues are underlined. Sequences are taken from Kloc et al. (1991) and references therein.
Figure 4
Figure 4
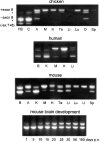
Differential splicing of paralemmin mRNA analyzed by RT-PCR. The differentially spliced region of chicken, human, and mouse paralemmin mRNA was amplified by RT-PCR, and amplification products resolved by agarose gel electrophoresis and stained with ethidium bromide. The first and third bands from the top represent RNAs with and without exon 8, and the second band from the top (asterisk) is a heteroduplex of both. Chicken forebrain and cerebellum additionally yield a product lacking both exons 7 and 8, and its heteroduplex (asterisk) with the “minus exon 8” PCR product. Tissues are designated as in Fig. 3, additional tissues are ovary (O) and uterus (U).
Figure 7
Figure 7
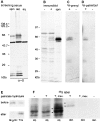
Analysis of paralemmin lipidation. (A) Immunoblot of chicken brain synaptic plasma membranes before (spm) and after Triton X-114 partitioning into detergent (det.) and aqueous (aq.) phases, developed with the screening serum (α-D) with which the original chicken paralemmin cDNA was isolated. The blot demonstrates that paralemmin (diffuse double band near the 66-kD marker) and GAP-43 (intense band below) are among the main antigens detected by this serum (15 μg protein per lane). (B) Immunoblot of COS-7 cell lysates (100 μg protein each) either expressing the chicken paralemmin cDNA (+) or transfected with the corresponding antisense expression plasmid (−), and of chicken brain synaptic plasma membranes (spm; 30 μg protein). (C) Prenylation of paralemmin, expressed from the chicken cDNA in COS-7 cells, demonstrated by metabolic labeling. Lysates (220 μg protein) of COS-7 cells transfected with chicken paralemmin cDNA in sense (+) or antisense (−) orientation and grown in the presence of [3H]mevalonolactone were subjected to immunoprecipitation with an antiserum against recombinant chicken paralemmin, and the precipitate analyzed by SDS-PAGE and fluorography for 41 d. (D) Palmitoylation of paralemmin demonstrated by metabolic labeling with [3H]palmitate. Lysates (220 μg) of COS-7 cells transfected with chicken paralemmin cDNA in sense (+) or antisense (−) orientation and grown in the presence of [3H]palmitate were subjected to immunoprecipitation with an antiserum against recombinant chicken paralemmin, and the precipitate analyzed by SDS-PAGE and fluorography for 41 d. (E) Release of paralemmin-bound [3H]palmitate by hydrolysis with hydroxylamine. An SDS gel with immunoprecipitates of [3H]palmitate-labeled paralemmin on two adjacent lanes was prepared as in part D. In this experiment, the lower band of the doublet seen in D was prominent whereas the upper band was very faint. After fluorography, the gel was re-swollen, cut between the lanes, and the left lane was incubated in 1 M hydroxylamine, pH 7.5, overnight whereas the right lane was control incubated in 1 M Tris, pH 7.5. Subsequently, both parts of the gel were again subjected to fluorography. The period of fluorography before and after hydrolysis was 3 mo each. (F) Inhibition of lipidation affects electrophoretic mobility and hydrophobicity of paralemmin. COS-7 cells were transfected with chicken paralemmin cDNA in sense (+) or antisense (−) orientation and grown in the presence of [35S]methionine and cysteine, plus, where indicated, the inhibitor of prenylation, mevinolin (mev.). Lysates were immunoprecipitated, and the precipitates were subjected to Triton X-114 phase partitioning. Aqueous (aq.) and detergent (det.) phases underwent SDS-PAGE followed by fluorography for 9 d. Dots mark positions of paralemmin bands.
Figure 6
Figure 6
Distribution of paralemmin among subcellular fractions of the purification course of chicken synaptic plasma membranes, in comparison to GAP-43 and amphiphysin. 25 μg of protein from each fraction was analyzed by immunoblotting. Fraction designations are as in Babitch et al. (1976). P2′″, washed 13,600 rpm pellet of brain homogenate (“mitochondrial pellet”). Fractions and subfractions of P2′″ after Ficoll step gradient: Fm, “mitochondrial fraction;” Scm and Pcm, “myelin supernatant and pellet;” Ss and Ps, “synaptosomal supernatant and pellet.” Fractions and subfractions after hypotonic lysis of Ps synaptosomes: Pls, “intrasynaptosomal mitochondria;” Phs, large membranes; Shs, cytosol and small vesicles. Saccharose step gradient fractions of Phs: 0/0.4, interface between 0 and 0.4 M saccharose, etc.; P, mitochondria-rich pellet. The course of purification of synaptic plasma membranes is P2′″–Ps–Phs; 0.4/0.6/0.8.
Figure 8
Figure 8
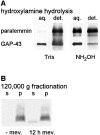
(A) Hydroxylamine hydrolysis reduces the hydrophobicity of native paralemmin. Chicken synaptic plasma membranes (130 μg protein) were incubated for 4 h with 1 M hydroxylamine, pH 7.5, or for control, with 1 M Tris, pH 7.5. After Triton X-114 phase partitioning, the aqeous (aq.) and detergent (det.) phases were subjected to SDS-PAGE and Western blotting, and paralemmin and GAP-43 were simultaneously visualized by development with antiserum α-D (compare with Fig. 7 A). (B) Paralemmin in undifferentiated NS20Y cells is entirely associated with the 120,000 g pellet (p), and mevinolin treatment causes the appearance of paralemmin also in the 120,000 g supernatant (s). NS20Y cells were grown at 10% serum in the absence (−mev.) of mevinolin and for 12 h in the presence of 50 μM mevinolin (12 h mev.). Cells were homogenized, subjected to 120,000 g fractionation, SDS-PAGE and blotting, and then the blot was developed with antibody No. 10 directed against recombinant mouse paralemmin. Cultivation of the cells in the presence of mevinolin for 24 h or longer led to pronounced morphological differentiation, and death and substrate detachment of an increasing number of cells; analysis was therefore terminated after 12 h.
Figure 11
Figure 11
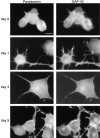
Redistribution of paralemmin and GAP-43 toward the periphery of NS20Y cells in the course of morphological differentiation induced by serum withdrawal. Cells typical for the different stages are visualized by double-immunofluorescence. Bar, 15 μm.
Figure 9
Figure 9
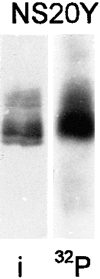
Incorporation of [32P]phosphate into paralemmin by metabolic labeling. NS20Y cells were grown in the presence of [32P]phosphate for 4 h, lysed, and then subjected to immunoprecipitation with rabbit anti–mouse paralemmin serum No. 10, SDS-PAGE, and then blotting onto nitrocellulose. The blot was first exposed to X-ray film for autoradiography (32P), and subsequently immunostained (i) with chicken anti–mouse paralemmin serum No. HB.
Figure 10
Figure 10
Subcellular distribution of endogenous paralemmin visualized by immunofluorescence microscopy in differentiated NS20Y neuroblastoma cells, L929 fibroblast cells, and PC12 pheochromocytoma cells. The PC12 cells at bottom right represent the subset of cells displaying the very intense staining of a perinuclear, reticular structure; photographic exposure of this image was shorter than at the left where the plasmalemmal and granular intracellular staining exhibited by all PC12 cells is seen. Bars: (NS20Y and PC12) 15 μm; (L929) 9.4 μm.
Figure 13
Figure 13
Overexpression of lipid-anchored paralemmin (+CaaX) but not of anchorless paralemmin (−CaaX) induces spreading and process formation in L929 fibroblasts. Typical fluorescence micrographs are shown of cells 48 and 72 h after transfection with the respective paralemmin constructs or with pEGFP-C1 (GFP) as negative control. Photographic negatives are shown for better reproduction of fine detail. GFP is visualized by its intrinsic fluorescence, and paralemmin with anti-paralemmin immunofluorescence. Note the background of weakly immunofluorescent cells that are either untransfected or low expressing transfected cells, illustrating the relative abundances of endogenous versus overexpressed recombinant paralemmin in this experimental system. The GFP and −CaaX images display the intrinsic tendency of L929 cells to spread and form processes during 3 d in culture that is grossly exaggerated by +CaaX paralemmin overexpression. Bar, 11 μm.
Figure 12
Figure 12
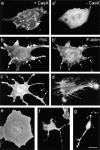
Characteristic aspects of the morphology of paralemmin overexpressing cells. (a, a′) +CaaX paralemmin is targeted to the plasmalemma where it concentrates at membrane protuberances, whereas −CaaX paralemmin is cytoplasmic (PC12 cells, immunolabeling with anti-myc). (b, b′) Double-fluorescent labeling of a +CaaX-transfected L929 cell for recombinant paralemmin (anti-myc) and F-actin (phalloidin). Paralemmin concentrates in membrane prominences like filopodia and microspike clusters, many of which are also labeled for F-actin (arrows). The cell has a well-structured stress fiber skeleton qualitatively indistinguishable from neighboring non-overexpressing cells of similar shape (not shown). (c) Dendritic L929 cell after +CaaX paralemmin transfection with labeling of plasma membrane protuberances including filopodia (arrows). Note the bright labeling of filopodial tips (anti-myc). (d) +CaaX paralemmin–expressing GM5756t cell featuring many long filopodia. Note the dotted pattern of paralemmin along and at the tips of filopodia (anti-paralemmin labeling). (e) COS-7 cell representing the broadly expanded early stage under +CaaX paralemmin expression, featuring a very flat cell shape and relatively smooth edges and surface (e–g, anti-paralemmin labeling). (f) COS-7 cell representing the partially collapsed later stage under +CaaX paralemmin expression, featuring a small but still flat perikaryal area displaying filopodial and lamellipodial membrane activity, and several long thin extensions carrying multiple varicosities. (g) COS-7 cell representing the late stage under +CaaX paralemmin expression, featuring a highly condensed cell body extending few, cable-like processes with varicosities but little membrane activity. Note that all three COS-7 cell types (e–g) are of equal magnification. Bar: (a–d) 2.5 μm; (e–g) 3.8 μm.
Figure 14
Figure 14
Overexpression of lipid-anchored paralemmin (+CaaX) but not of anchorless paralemmin (−CaaX) induces spreading and subsequent collapse of COS-7 cells. Typical fluorescence micrographs are shown of cells 24, 48, and 72 h after transfection with the respective paralemmin constructs. Photographic negatives are shown for better reproduction of fine detail. Control cells transfected in parallel with pEGFP-C1 (not shown) displayed shapes indistinguishable from the −CaaX-transfected cells at the respective time points. Recombinant paralemmin is visualized by immunofluorescence with the myc tag antibody. Bar, 15 μm.
Figure 15
Figure 15
Immunocytochem ical visualization of paralemmin in rat cerebellum. m, molecular layer; p, Purkinje cell layer; g, granule cell layer; md, medulla. Bar, 72 μm.
Figure 16
Figure 16
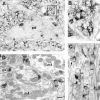
Immunoelectron micrographs of paralemmin-positive structures in the rat cerebellar cortex. (A) The thick proximal Purkinje cell dendrite (pd) in the molecular layer contains several patches of immunoreaction product and is surrounded by many smaller, heterogeneously stained cell processes, most of them cross-sectioned parallel fibers (magnification shown in B). (C) Longitudinally sectioned parallel fibers (ax) exhibit a discontinuous distribution of immunoreaction product. An immunonegative axonal terminal contacts a positive Purkinje cell spine (arrow). (D) In the granule cell layer, immunonegative mossy fiber terminals (mf) are surrounded by several immunopositive granule cell dendrites (gd) showing aggregates of immunoreaction product associated with the plasma membrane. Bar: (A) 750 nm; (B) 200 nm; (C) 400 nm; (D) 300 nm.

Similar articles

Cited by

References

    1. Aarts LHJ, Schrama LH, Hage WJ, Bos JL, Gispen WH, Schotman P. B-50/GAP-43-induced formation of filopodia depends on Rho-GTPase. Mol Biol Cell. 1998;9:1279–1292. - PMC - PubMed
    1. Adamson P, Marshall CJ, Hall A, Tilbrook PA. Post-translational modifications of p21rho proteins. J Biol Chem. 1992;267:20033–20038. - PubMed
    1. Aigner L, Arber S, Kapfhammer JP, Laux T, Schneider C, Botteri F, Brenner H-R, Caroni P. Overexpression of the neural growth-associated protein GAP-43 induces nerve sprouting in the adult nervous system of transgenic mice. Cell. 1995;83:269–278. - PubMed
    1. Allen LH, Aderem A. A role for MARCKS, the α isozyme of protein kinase C and myosin I in zymosan phagozytosis by macrophages. J Exp Med. 1995;182:829–840. - PMC - PubMed
    1. Babitch JA, Breithaupt TB, Chiu T-C, Garadi R, Helseth DL. Preparation of chick brain synaptosomes and synaptosomal membranes. Biochim Biophys Acta. 1976;433:75–89. - PubMed

Publication types

MeSH terms

Associated data