. 1998 Oct 19;143(2):333-49.
doi: 10.1083/jcb.143.2.333.

The dynamin-related GTPase, Dnm1p, controls mitochondrial morphology in yeast

Affiliations

The dynamin-related GTPase, Dnm1p, controls mitochondrial morphology in yeast

D Otsuga et al. J Cell Biol. .

Abstract

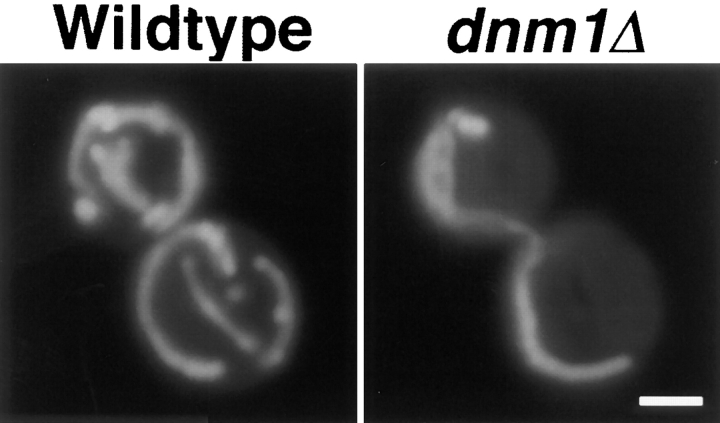
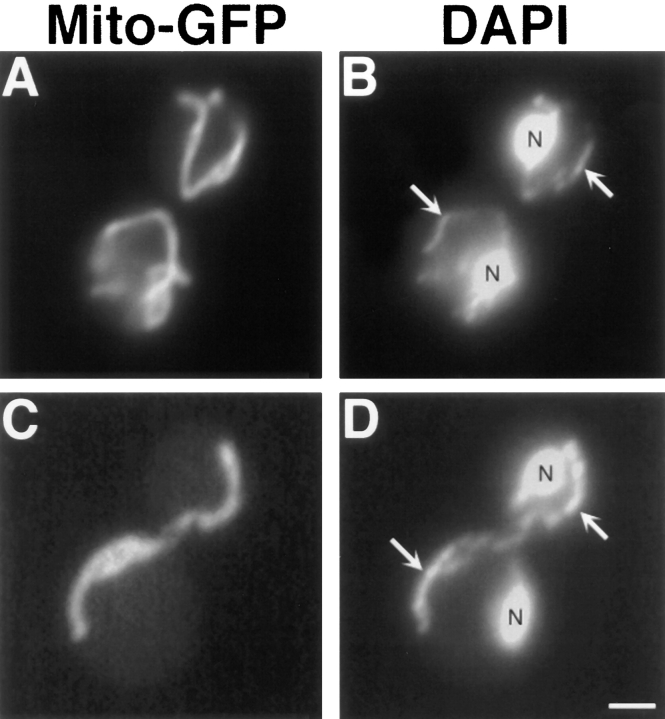
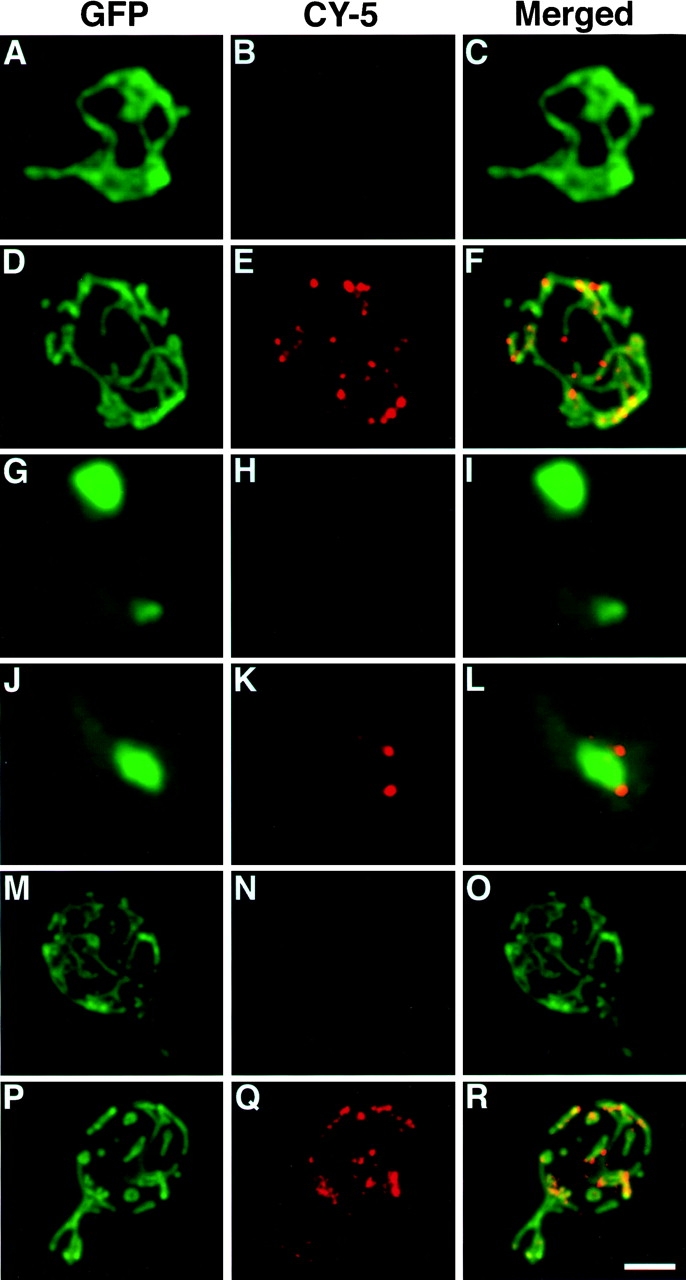
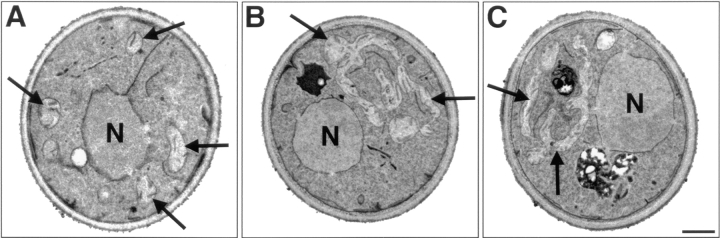
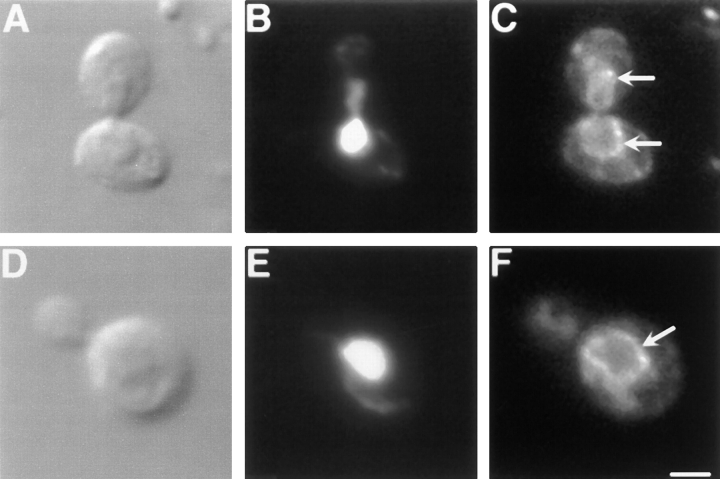
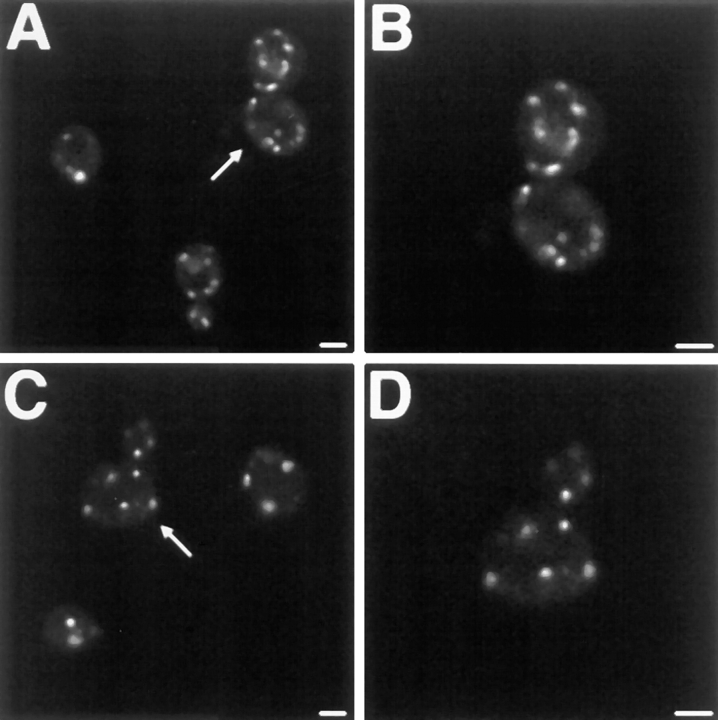
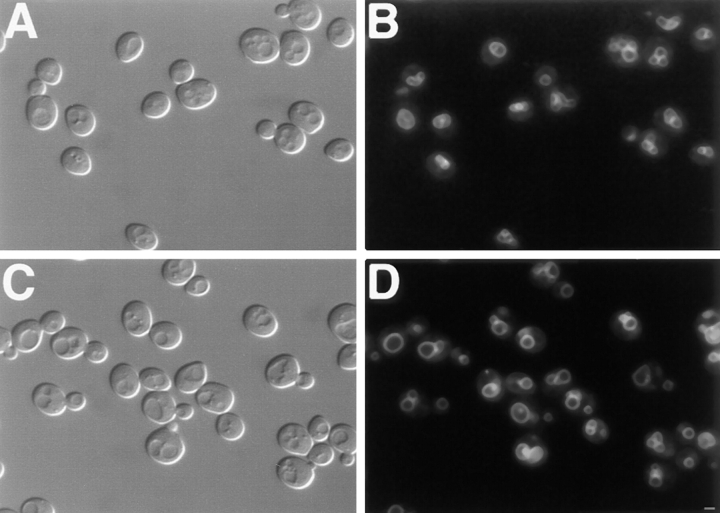
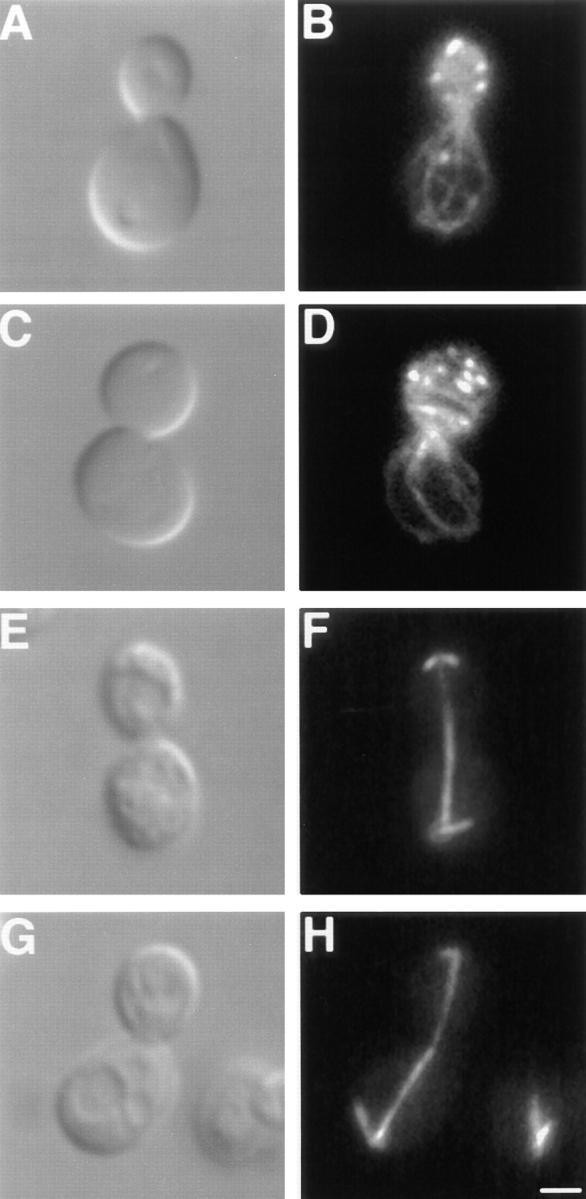
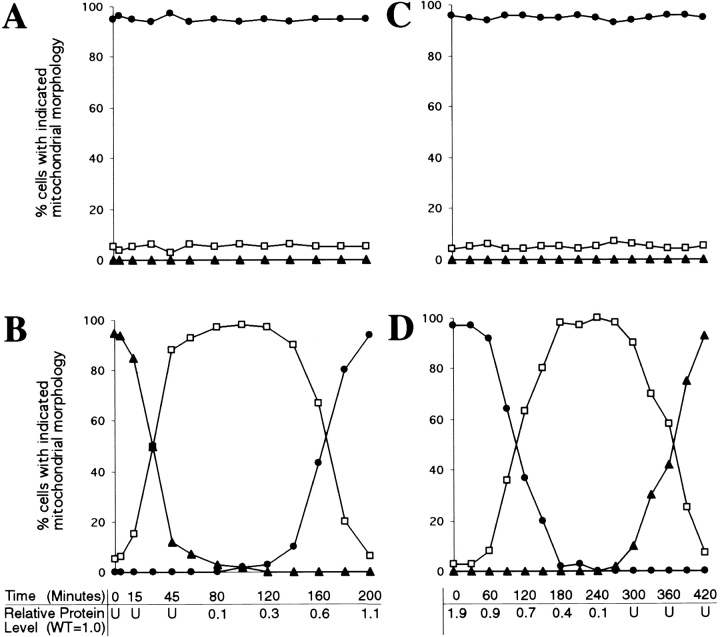
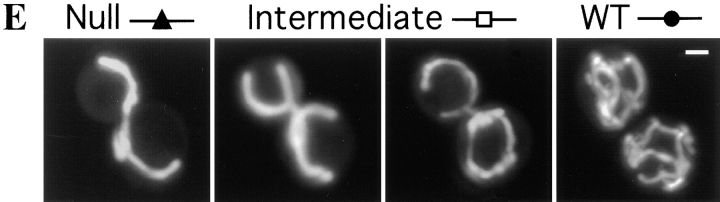
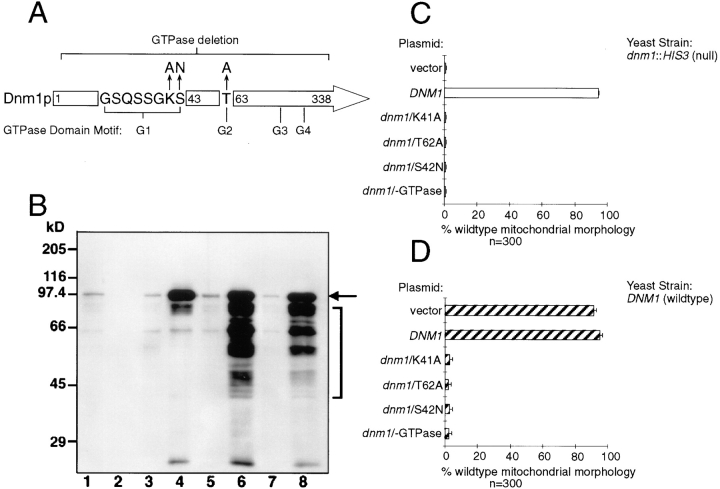
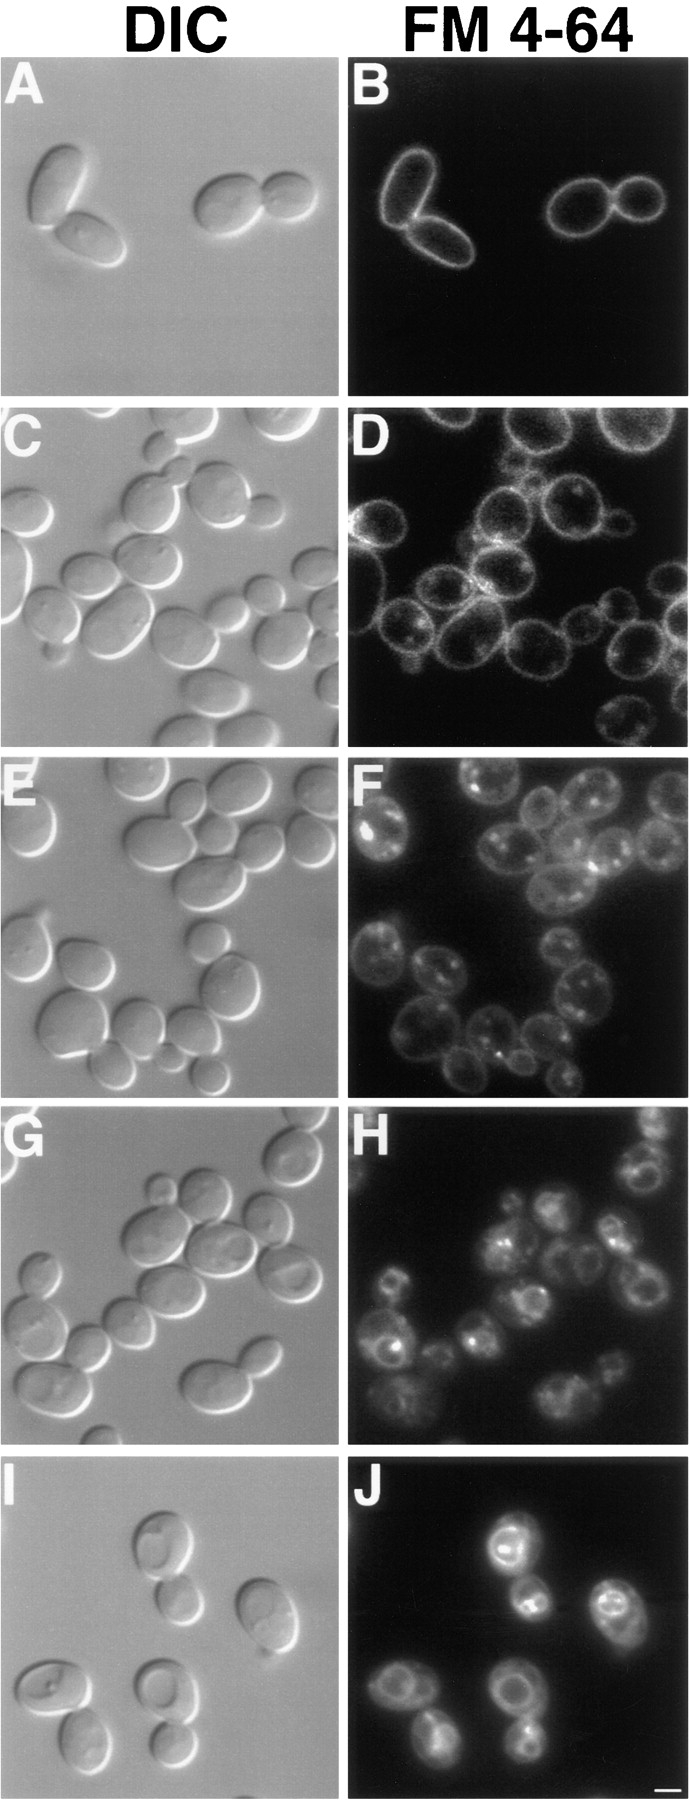
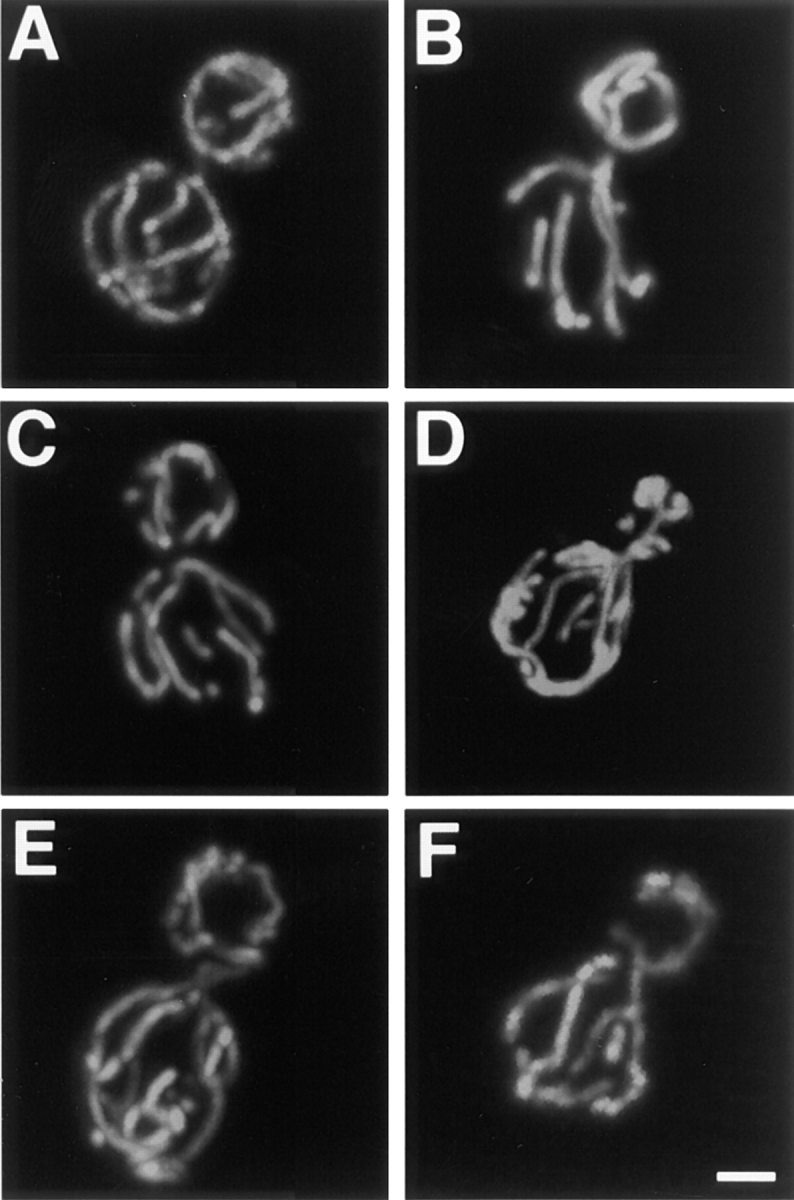
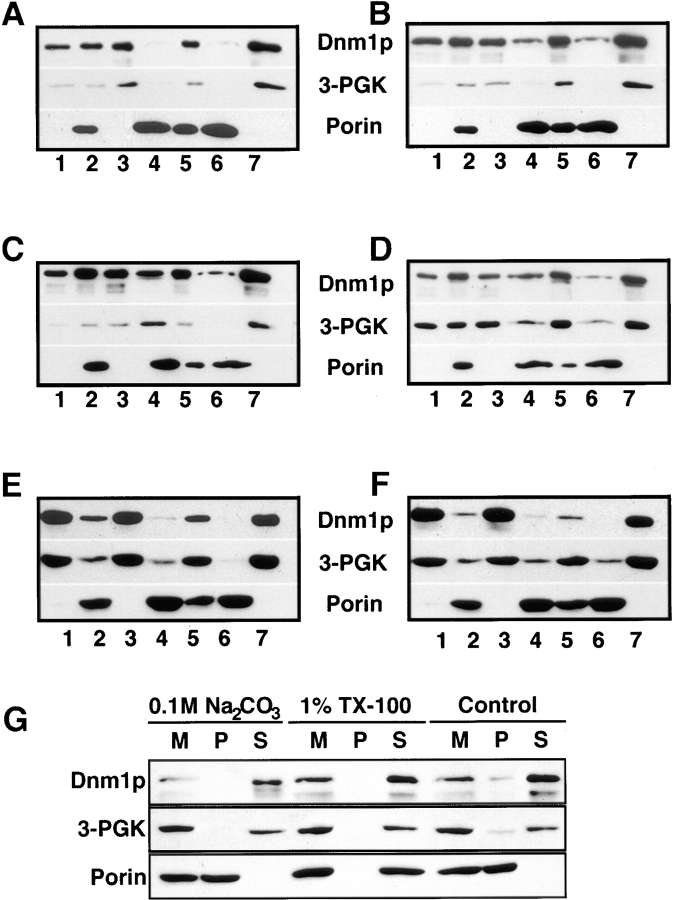
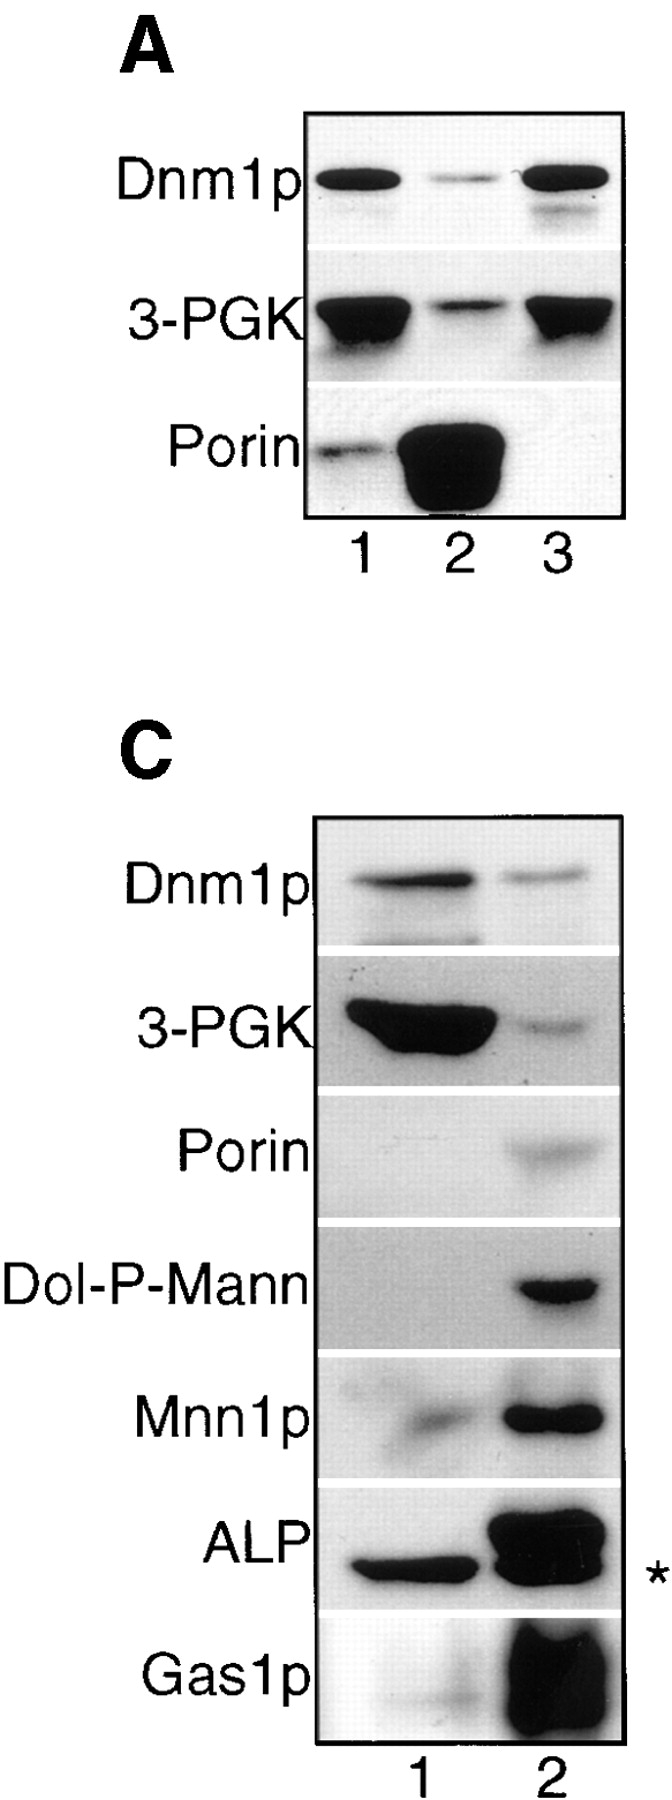
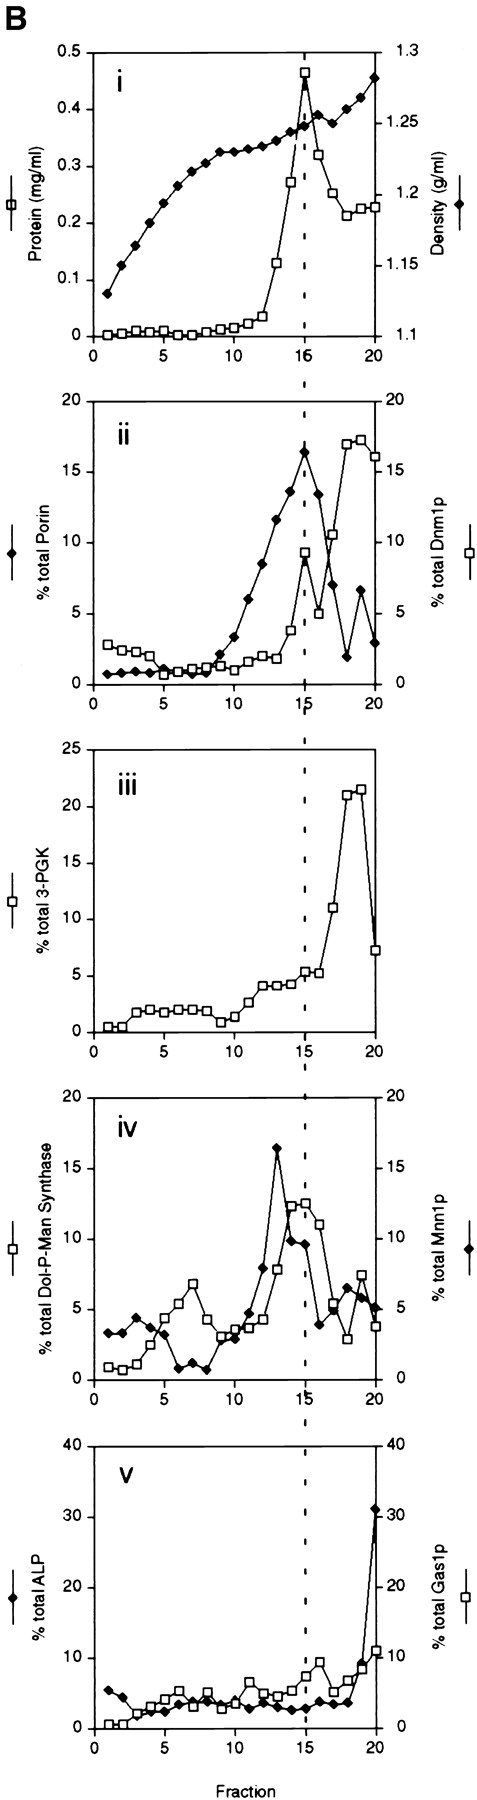
The Saccharomyces cerevisiae Dnm1 protein is structurally related to dynamin, a GTPase required for membrane scission during endocytosis. Here we show that Dnm1p is essential for the maintenance of mitochondrial morphology. Disruption of the DNM1 gene causes the wild-type network of tubular mitochondrial membranes to collapse to one side of the cell but does not affect the morphology or distribution of other cytoplasmic organelles. Dnm1 proteins containing point mutations in the predicted GTP-binding domain or completely lacking the GTP-binding domain fail to rescue mitochondrial morphology defects in a dnm1 mutant and induce dominant mitochondrial morphology defects in wild-type cells. Indirect immunofluorescence reveals that Dnm1p is distributed in punctate structures at the cell cortex that colocalize with the mitochondrial compartment. These Dnm1p-containing structures remain associated with the spherical mitochondria found in an mdm10 mutant strain. In addition, a portion of Dnm1p cofractionates with mitochondrial membranes during differential sedimentation and sucrose gradient fractionation of wild-type cells. Our results demonstrate that Dnm1p is required for the cortical distribution of the mitochondrial network in yeast, a novel function for a dynamin-related protein.


Figures

Figure 1
Figure 1
Mitochondrial morphology in wild-type (DNM1) and dnm1Δ mutant strains. Mitochondrial morphology in the DNM1 (JSY1238, left) and dnm1Δ (JSY1361, right) strains were visualized using a matrix-targeted form of the green fluorescent protein (Cox4–GFP). Buds are in the upper left portion of each panel. Bar, 2 μm.
Figure 2
Figure 2
Collapsed dnm1Δ mitochondria retain mtDNA nucleoids. DNM1 (JSY1238, A and B) and dnm1Δ (JSY1361, C and D) strains labeled with Cox4–GFP (A and C) to visualize mitochondrial compartments and DAPI (B and D) to visualize nuclei (N) and mtDNA (B and D, white arrows). Buds are in the upper right portion of each panel. Bar, 2 μm.
Figure 12
Figure 12
Dnm1p colocalizes with the yeast mitochondrial network. Wild-type (JSY1781, A–F; JSY1238, M–R) or mdm10 mutant (JSY1729, G–L) cells expressing Dnm1– HACp (A–L) or wild-type Dnm1p (M–R) were fixed and incubated with no primary antibody (A–C, G–I, and M–O), anti-HA antibody (D–F and J–L), or anti-Dnm1p412–757 antibody (P–R). A CY5-conjugated secondary antibody (red fluorescence in B, E, H, K, N, and Q) was used to visualize the Dnm1–HAc and Dnm1 proteins. Mitochondrial networks were visualized by expressing the matrix-targeted Cox4–GFP protein (green fluorescence in A, D, G, J, M, and P) in the same cells. The merged CY5 and GFP images are shown in C, F, I, L, O, and R. Bar, 2 μm.
Figure 3
Figure 3
Transmission electron microscopy of DNM1 and dnm1Δ cells. (A) Mitochondrial profiles (black arrows) in DNM1 cells (JSY1238) are uniformly dispersed in the peripheral cytoplasm and contain visible cristae. (B and C) Mitochondrial profiles (black arrows) in dnm1Δ cells (JSY1361) contain normal cristae but appear as enlarged tubules clustered at one side of the cell. Bar, 500 nm.
Figure 4
Figure 4
ER morphology is wild type in dnm1Δ cells. DIC (A and D), DAPI (B and E), and indirect immunofluorescence images (C and F) of DNM1 (JSY1238, A–C) and dnm1Δ (JSY1361, D–F) cells stained with anti-Kar2p antiserum. Buds are in the upper portion of each panel. White arrows in C and F mark the perinuclear ER stained with anti-Kar2p antiserum. Bar, 2 μm.
Figure 5
Figure 5
Golgi apparatus morphology is wild type in dnm1Δ cells. Confocal microscopy images of DNM1 (JSY1238, A and B) and dnm1Δ (JSY1361, C and D) cells labeled with the peripheral Golgi membrane marker, Sec7p-EGFP. White arrows in A and C indicate magnified cells shown in B and D, respectively. Bars, 2 μm.
Figure 6
Figure 6
Vacuole morphology is wild type in dnm1Δ cells. Differential interference contrast (A and C) and fluorescence images (B and D) of DNM1 (JSY1238, A and B) and dnm1Δ (JSY1361, C and D) cells labeled with the vacuole membrane–specific styryl dye, FM 4-64. Bar, 2 μm.
Figure 7
Figure 7
Actin and tubulin cytoskeleton organization are wild type in dnm1Δ cells. Differential interference contrast images (A, C, E, and G), rhodamine-phalloidin–stained actin (B and D), and antitubulin staining (F and H) of DNM1 (JSY1238; A, B, E, and F) and dnm1Δ (JSY1361; C, D, G, and H) cells. Buds are in the upper portion of each panel. Bar, 2 μm.
Figure 8
Figure 8
Mitochondrial morphology changes in response to changes in DNM1 gene expression. Null (closed triangles), intermediate (open squares), and wild-type (closed circles) mitochondrial morphologies were quantified by DiOC6 staining in cells containing a single genomic copy of the wild-type DNM1 (JSY1238; A and C) or GAL1-DNM1 (JSY1678; B and D) gene. (A) DNM1 cells transferred from dextrose to galactose. (B) GAL1-DNM1 cells transferred from dextrose to galactose. (C) DNM1 cells transferred from galactose to dextrose. (D) GAL1-DNM1 cells transferred from galactose to dextrose. The amount of Dnm1p expressed in the GAL1-DNM1 strain relative to the DNM1 strain is indicated for selected time points below graphs B and D. (WT = DNM1 = 1.0; U, undetected). (E) Representative examples of Null (closed triangles), intermediate (open squares), and WT (DNM1; closed circles) mitochondrial morphologies. Buds are in the upper portion of each panel. Bar, 2 μm.
Figure 8
Figure 8
Mitochondrial morphology changes in response to changes in DNM1 gene expression. Null (closed triangles), intermediate (open squares), and wild-type (closed circles) mitochondrial morphologies were quantified by DiOC6 staining in cells containing a single genomic copy of the wild-type DNM1 (JSY1238; A and C) or GAL1-DNM1 (JSY1678; B and D) gene. (A) DNM1 cells transferred from dextrose to galactose. (B) GAL1-DNM1 cells transferred from dextrose to galactose. (C) DNM1 cells transferred from galactose to dextrose. (D) GAL1-DNM1 cells transferred from galactose to dextrose. The amount of Dnm1p expressed in the GAL1-DNM1 strain relative to the DNM1 strain is indicated for selected time points below graphs B and D. (WT = DNM1 = 1.0; U, undetected). (E) Representative examples of Null (closed triangles), intermediate (open squares), and WT (DNM1; closed circles) mitochondrial morphologies. Buds are in the upper portion of each panel. Bar, 2 μm.
Figure 9
Figure 9
GTPase domain mutations in DNM1 cause dominant interfering phenotypes in vivo. (A) The position of the four, NH2-terminal GTP-binding consensus elements (G1–G4) conserved among different dynamin family members is shown. The point mutations (arrows) and the deletion mutation (bracket) used in this study are indicated. The G1 dnm1K41A mutation and the deletion mutation are predicted to abolish nucleotide binding, the G1 dnm1S42N mutation is predicted to bind GDP more tightly than GTP, and the G2 dnm1T62A mutation is equivalent to a mutation in the ras GTPase that abolishes effector interactions (see text for references). (B) Endogenous and plasmid expression levels of wild-type and GTPase mutant forms of Dnm1p. A total cell extract from each strain was analyzed by Western blotting with anti-Dnm1p antiserum. Lane 1, DNM1 (JSY1238); lane 2, dnm1Δ (dnm1:: HIS3, JSY1361); lane 3, dnm1Δ + pRU1-dnm1K41A (CEN, single copy); lane 4, dnm1Δ + YEP213-dnm1K41A (2μ, multicopy); lane 5, dnm1Δ + pRU1-dnm1T62A; lane 6, dnm1Δ + YEP213-dnm1T62A; lane 7, dnm1Δ + pRU1-dnm1S42N; lane 8, dnm1Δ + YEP213-dnm1S42N. The black arrow marks the full-length form of wild-type and mutant Dnm1 proteins. Dnm1p breakdown products (bracket) accumulate in cells overexpressing Dnm1 proteins. Expression of the dnm1/-GTPase deletion mutant protein from the pRU1 and YEP213 plasmids was similar to that shown for the other mutants (not shown). (C) DiOC6 staining was used to quantify the ability of a multicopy vector alone (YEP213; LEU2), or the vector containing wild-type (DNM1) or mutated (dnm1/K41A, dnm1/T62A, dnm1/S42N, dnm1/-GTPase) forms of the DNM1 gene to restore wild-type mitochondrial morphology in dnm1::HIS3 null cells (JSY1361). The percentage of cells with wild-type mitochondrial morphology is indicated in each case (open bars). (D) The ability of the constructs described in C to induce mitochondrial morphology phenotypes in a wild-type DNM1 strain (JSY1238) was quantified by DiOC6 staining. The percentage of cells with wild-type mitochondrial morphology is indicated in each case (hatched bars). (E) The mutant constructs described in C (dnm1/K41A, dnm1/T62A, dnm1/S42N, and dnm1/-GTPase) failed to induce mitochondrial morphology defects in cells overexpressing Dnm1p from a genomic GAL1-DNM1 gene (JSY1678) (closed bars; overexpressed Dnm1p levels are approximately twofold that of the wildtype DNM1 strain). The dominant interfering phenotypes caused by these mutations in a strain expressing Dnm1p at wild-type levels (D; DNM1, JSY1238; hatched bars) are shown for comparison.
Figure 9
Figure 9
GTPase domain mutations in DNM1 cause dominant interfering phenotypes in vivo. (A) The position of the four, NH2-terminal GTP-binding consensus elements (G1–G4) conserved among different dynamin family members is shown. The point mutations (arrows) and the deletion mutation (bracket) used in this study are indicated. The G1 dnm1K41A mutation and the deletion mutation are predicted to abolish nucleotide binding, the G1 dnm1S42N mutation is predicted to bind GDP more tightly than GTP, and the G2 dnm1T62A mutation is equivalent to a mutation in the ras GTPase that abolishes effector interactions (see text for references). (B) Endogenous and plasmid expression levels of wild-type and GTPase mutant forms of Dnm1p. A total cell extract from each strain was analyzed by Western blotting with anti-Dnm1p antiserum. Lane 1, DNM1 (JSY1238); lane 2, dnm1Δ (dnm1:: HIS3, JSY1361); lane 3, dnm1Δ + pRU1-dnm1K41A (CEN, single copy); lane 4, dnm1Δ + YEP213-dnm1K41A (2μ, multicopy); lane 5, dnm1Δ + pRU1-dnm1T62A; lane 6, dnm1Δ + YEP213-dnm1T62A; lane 7, dnm1Δ + pRU1-dnm1S42N; lane 8, dnm1Δ + YEP213-dnm1S42N. The black arrow marks the full-length form of wild-type and mutant Dnm1 proteins. Dnm1p breakdown products (bracket) accumulate in cells overexpressing Dnm1 proteins. Expression of the dnm1/-GTPase deletion mutant protein from the pRU1 and YEP213 plasmids was similar to that shown for the other mutants (not shown). (C) DiOC6 staining was used to quantify the ability of a multicopy vector alone (YEP213; LEU2), or the vector containing wild-type (DNM1) or mutated (dnm1/K41A, dnm1/T62A, dnm1/S42N, dnm1/-GTPase) forms of the DNM1 gene to restore wild-type mitochondrial morphology in dnm1::HIS3 null cells (JSY1361). The percentage of cells with wild-type mitochondrial morphology is indicated in each case (open bars). (D) The ability of the constructs described in C to induce mitochondrial morphology phenotypes in a wild-type DNM1 strain (JSY1238) was quantified by DiOC6 staining. The percentage of cells with wild-type mitochondrial morphology is indicated in each case (hatched bars). (E) The mutant constructs described in C (dnm1/K41A, dnm1/T62A, dnm1/S42N, and dnm1/-GTPase) failed to induce mitochondrial morphology defects in cells overexpressing Dnm1p from a genomic GAL1-DNM1 gene (JSY1678) (closed bars; overexpressed Dnm1p levels are approximately twofold that of the wildtype DNM1 strain). The dominant interfering phenotypes caused by these mutations in a strain expressing Dnm1p at wild-type levels (D; DNM1, JSY1238; hatched bars) are shown for comparison.
Figure 10
Figure 10
Kinetics of FM 4-64 internalization. DNM1 (JSY1238) and dnm1Δ (JSY1361) cells grown in YPD medium were labeled with FM 4-64 for 30 min at 0°C, washed, and chased in fresh medium at 30°C for 60 min. Aliquots removed at 0 (A and B), 10 (C and D), 20 (E and F), 40 (G and H), and 60 (I and J) min were scored for FM 4-64 distribution (see Table II) and photographed. Representative differential interference contrast (A, C, E, G, and I) and fluorescence (B, D, F, H, and J) images are shown for the dnm1Δ strain and were identical to those observed in wild type. Bar, 2 μm.
Figure 11
Figure 11
Mitochondrial morphology is wild type in mutants that block endocytosis. Mitochondrial morphology was visualized with Cox4–GFP in wild-type (A), end3 (B), end4 (C), vps4 (D), vps18 (E), and pan1 (F) cells under conditions that produce an endocytosis defect in the mutants. The wild-type mitochondrial morphology observed in A was also observed in >95% of the mutant cells. Buds are in the upper portion of each panel. Bar, 2 μm.
Figure 13
Figure 13
Distribution of Dnm1p in wild-type and mutant yeast cells after differential sedimentation. Yeast cells were spheroplasted, lysed, and sedimented at 1,500 g to remove unlysed cells and debris. The soluble extracts were sedimented at 10,000 g generating (lane 1) extract, (lane 2) P10,000 (contains mitochondria), and (lane 3) S10,000. The P10,000 pellet was resuspended and sedimented again at 1,500 g to remove aggregates and debris generating (lane 4) P1,500 and (lane 5) S1,500. S1,500 was spun at 10,000 g generating (lane 6) washed P10,000 and (lane 7) S10,000 wash. Fractions (2 μg protein) were separated by SDS-PAGE and analyzed by Western blotting with anti-Dnm1p, anti–3-PGK (cytoplasm), and antiporin (mitochondria) serum. Strains: (A) DNM1 (JSY1238), (B) DNM1 + pRU1-DNM1, (C) DNM1 + pRU1- dnm1K41A, (D) dnm1Δ (JSY1361) + pRU1-dnm1K41A, (E) MDM10 (JSY1914), (F) mdm10Δ (JSY1916). (G) P10,000 pellets (M) containing mitochondria were treated to dissociate peripheral membrane proteins (0.1 M Na2CO3) or solubilize integral membrane proteins (1% Triton X-100), separated into pellet (P) and supernatant (S) fractions, and analyzed by SDS-PAGE and Western blotting with anti-Dnm1p, anti–3-PGK, and antiporin serum. The release of soluble cytochrome b 2 and the peripheral F1β ATPase subunit into the supernatant fraction after 0.1 M Na2CO3 treatment was confirmed by Western blotting (data not shown).
Figure 14
Figure 14
Elution profile of Dnm1p and organelle membrane markers after sucrose density fractionation of P10,000 from wild-type cells. (A) (lane 1) Extract, (lane 2) P10,000, and (lane 3) S10,000 fractions were generated and analyzed as described in the legend to Fig. 13. (B) The P10,000 pellet from A was resuspended in 60% sucrose and loaded on the bottom of a 35–60% sucrose gradient. The gradient was spun to equilibrium and fractionated, and equal volumes of each fraction were analyzed by Western blotting and densitometry. Results are expressed as the percent total signal per fraction. Density (g/ml); protein (μg/ml). Fraction 1 is the top of the gradient and fraction 20 is the gradient pellet. The dotted line transects fraction 15 in each graph. (C) S10,000 supernatant from A was spun at 100,000 g and equivalent volumes of the resulting S100,000 (lane 1) and P100,000 (lane 2) fractions were analyzed by SDS-PAGE and Western blotting with anti-Dnm1p, anti– 3-PGK, antiporin, anti–Dol-P-Man (endoplasmic reticulum), anti- Mnn1p (Golgi apparatus), anti-ALP (vacuole), and anti-Gas1p (plasma membrane) serum. The asterisk (*) marks a soluble, ALP breakdown product in the vacuole lumen that is partially released during fractionation (Stepp et al., 1997; Vowels and Payne, 1998).
Figure 14
Figure 14
Elution profile of Dnm1p and organelle membrane markers after sucrose density fractionation of P10,000 from wild-type cells. (A) (lane 1) Extract, (lane 2) P10,000, and (lane 3) S10,000 fractions were generated and analyzed as described in the legend to Fig. 13. (B) The P10,000 pellet from A was resuspended in 60% sucrose and loaded on the bottom of a 35–60% sucrose gradient. The gradient was spun to equilibrium and fractionated, and equal volumes of each fraction were analyzed by Western blotting and densitometry. Results are expressed as the percent total signal per fraction. Density (g/ml); protein (μg/ml). Fraction 1 is the top of the gradient and fraction 20 is the gradient pellet. The dotted line transects fraction 15 in each graph. (C) S10,000 supernatant from A was spun at 100,000 g and equivalent volumes of the resulting S100,000 (lane 1) and P100,000 (lane 2) fractions were analyzed by SDS-PAGE and Western blotting with anti-Dnm1p, anti– 3-PGK, antiporin, anti–Dol-P-Man (endoplasmic reticulum), anti- Mnn1p (Golgi apparatus), anti-ALP (vacuole), and anti-Gas1p (plasma membrane) serum. The asterisk (*) marks a soluble, ALP breakdown product in the vacuole lumen that is partially released during fractionation (Stepp et al., 1997; Vowels and Payne, 1998).

Similar articles

Cited by

References

    1. Adari H, Lowy DR, Willumsen BM, Der CJ, McCormick F. Guanosine triphosphatase activating protein (GAP) interacts with the p21 raseffector binding domain. Science. 1988;240:518–521. - PubMed
    1. Babst M, Sato TK, Banta LM, Emr SD. Endosomal transport function in yeast requires a novel AAA-type ATPase, Vps4p. EMBO (Eur Mol Biol Organ) J. 1997;16:1820–1831. - PMC - PubMed
    1. Bakeeva LE, Chentsov YS, Skulachev VP. Mitochondrial framework (reticulum mitochondriale) in rat diaphragm muscle. Biochim Biophys Acta. 1978;501:349–369. - PubMed
    1. Benedetti H, Raths S, Crausaz F, Riezman H. The END3gene encodes a protein that is required for the internalization step of endocytosis and for actin cytoskeleton organization in yeast. Mol Biol Cell. 1994;5:1023–1037. - PMC - PubMed
    1. Bereiter-Hahn J. Behavior of mitochondria in the living cell. Int Rev Cytol. 1990;122:1–63. - PubMed

Publication types

MeSH terms