. 1998 Oct 15;18(20):8214-27.
doi: 10.1523/JNEUROSCI.18-20-08214.1998.

Delayed release of neurotransmitter from cerebellar granule cells

Affiliations

Delayed release of neurotransmitter from cerebellar granule cells

P P Atluri et al. J Neurosci. .

Abstract

At fast chemical synapses the rapid release of neurotransmitter that occurs within a few milliseconds of an action potential is followed by a more sustained elevation of release probability, known as delayed release. Here we characterize the role of calcium in delayed release and test the hypothesis that facilitation and delayed release share a common mechanism. Synapses between cerebellar granule cells and their postsynaptic targets, stellate cells and Purkinje cells, were studied in rat brain slices. Presynaptic calcium transients were measured with calcium-sensitive fluorophores, and delayed release was detected with whole-cell recordings. Calcium influx, presynaptic calcium dynamics, and the number of stimulus pulses were altered to assess their effect on delayed release and facilitation. Following single stimuli, delayed release can be separated into two components: one lasting for tens of milliseconds that is steeply calcium-dependent, the other lasting for hundreds of milliseconds that is driven by low levels of calcium with a nearly linear calcium dependence. The amplitude, calcium dependence, and magnitude of delayed release do not correspond to those of facilitation, indicating that these processes are not simple reflections of a shared mechanism. The steep calcium dependence of delayed release, combined with the large calcium transients observed in these presynaptic terminals, suggests that for physiological conditions delayed release provides a way for cells to influence their postsynaptic targets long after their own action potential activity has subsided.


Figures
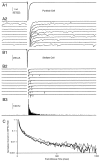
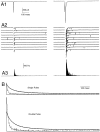
Fig. 1.
Fig. 1.
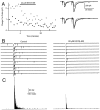
Comparisons of phasic and delayed release at the granule cell to Purkinje (A) and granule cell to stellate (B) cell synapses evoked by 0.133 Hz electrical stimulation of the parallel fibers. Shown are phasic EPSCs (A1, B1) and 10 consecutive trials showing delayed mEPSCs (A2, B2). These trials are blanked from 0 to 20 msec (A2) or from 0 to 10 msec (B2) for clarity and are offset vertically by 200 and 100 pA, respectively. The peristimulus time histogram (B3) of the stellate cell mEPSCs is blanked from 0 to 10 msec. C, Semilogarithmic plot of normalized representative Purkinje (thick line) and stellate (thin line) cell EPSCs (same traces asA1 and B1) and stellate cell mEPSC histogram (dashed line). Traces in A1 andB1 are averaged from 197 and 392 trials, respectively. With an approximation of the decays of synaptic currents with single exponentials, the time constants of decay for the average mEPSC and evoked EPSC are 6.4 and 7.8 msec for the Purkinje cell inA and 0.8 and 2.3 msec for the stellate cell inB. The synaptic current measured in A is somewhat slowed, because large stimulus strengths were used to accentuate the delayed release of neurotransmitter. The spontaneous mEPSC frequency was 9.9 Hz for the Purkinje cell in Aand 0.03 Hz for the stellate cell in B.
Fig. 2.
Fig. 2.
Paired-pulse facilitation at the granule to stellate cell synapse. The percentage of facilitation of integrated EPSC areas, 100 (A2A1)/A1, is plotted as a function of interstimulus interval. Each point is the mean PPF ± SEM; n = 10. The smooth curve is a monoexponential fit, omitting the first data point.Inset, Synaptic currents evoked by extracellular stimulation of the parallel fibers with pulses separated by 40 msec. The shaded areas labeled A1 andA2 illustrate the integration times that were used to calculate the charge per pulse.
Fig. 3.
Fig. 3.
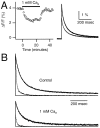
Differential effect of external calcium concentration on facilitation and delayed release. Synaptic currents were recorded in 2 mm Ca (control) and during bath application of 1 mm Ca. Each double-pulse facilitation trial (A) was followed by 10 single-pulse delayed release trials (B). A, Areas of conditioning (filled circles) and test (open circles) EPSCs are plotted (left panel) during bath application of 1 mmexternal calcium. The right panel shows traces that are averages of 14 trials for control (thick line) and low calcium (thin line) on the same vertical scale (top panel) or that are normalized (bottom panel) to the peak of the first EPSC. There was a slight decrease in the duration of the facilitated EPSC in 1 mmCae as compared with 2 mm Cae (see Materials and Methods). B, Ten successive traces, each offset vertically by 100 pA, in control (left panel) and low (right panel) calcium. C, Histograms of mEPSCs in control (left panel) and in low calcium (right panel). In B and C the times from 0 to 10 msec have been blanked for clarity.
Fig. 4.
Fig. 4.
Differential effect of 20 μm EGTA-AM on facilitation and delayed release. Double-pulse facilitation trials (A) were interspersed among single-pulse delayed release trials (B). A, Areas of conditioning (filled circles) and test (open circles) EPSCs are plotted (left panel) during a 15 min bath application of 20 μm EGTA-AM. The right panel shows control (thick) and postapplication (thin) traces that are averages of 7 and 13 trials, respectively. The top traces are on the same scale; the bottom tracesare normalized to the peak of the first EPSC. EGTA-AM decreased the duration of the facilitated EPSC (see Materials and Methods).B, Ten successive trials before (left panel) and after (right panel) treatment with EGTA-AM. C, Histograms of mEPSCs before (left panel) and after (right panel) EGTA-AM treatment. In B andC the times from 0 to 10 msec have been blanked for clarity.
Fig. 5.
Fig. 5.
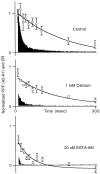
Summary of the effect of low calcium and 20 μm EGTA-AM on facilitation and delayed release. The average time course, from 0 to 300 msec, of A2A1 facilitation (open circles) and delayed release are plotted together for control (top), low calcium (middle), and 20 μmEGTA-AM-treated slices (bottom). Delayed release histograms for low calcium and for 20 μm EGTA-AM first were normalized by the associated pretreatment histograms from each cell and then were averaged together.
Fig. 6.
Fig. 6.
The effect of external Ca concentration on presynaptic Ca transients and delayed release. Fluorescence (ΔF/F) transients were monitored in granule cell presynaptic terminals by the low-affinity Ca dye magnesium green. A, Circles (left panel) represent peaks of fluorescence transients during a change in the bath solution from 2 mm Cae(right panel, top trace) to 1 mm Cae (right panel, bottom trace). B, Normalized average calcium transients (thick traces) and delayed release histograms (thin traces) are shown in 2 mmCae (top panel) and 1 mmCae (bottom panel), respectively.
Fig. 7.
Fig. 7.
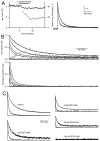
The effect of EGTA-AM concentration on presynaptic Ca transients and delayed release. Fluorescence (ΔF/F) transients were monitored as in Figure 6. A, Filled and open circles (left panel) represent peaks and half-decay times, respectively, of fluorescence transients before (right panel, top trace) and after (right panel, bottom trace) a 15 min application of 5 μm EGTA-AM. B, Application of 0, 1, 5, 20, or 100 μm EGTA-AM causes a dose-dependent diminution and acceleration of normalized average presynaptic Ca transients (top panel) and delayed release histograms (bottom panel).C, Comparison of normalized average calcium transients (top traces) and delayed release histograms from 0, 1 5, 20, and 100 μm EGTA-AM experiments.
Fig. 8.
Fig. 8.
The effect of the number of stimulus pulses on presynaptic Ca transients and delayed release in 1 mmexternal Ca. Shown are phasic EPSCs (A1), delayed mEPSCs (A2) in 10 consecutive trials, and mEPSC histograms (A3) for single-pulse (left panels) or double-pulse (right panels) stimuli. Times from 0 to 10 msec (left panels) or from 0 to 20 msec (right panels) are blanked for clarity (A2,A3). B, Normalized average calcium transients (top traces) and delayed release histograms after single (top panel) or double (bottom panel) pulses.
Fig. 9.
Fig. 9.
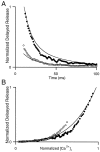
Steady-state models relating calcium to delayed release are inadequate. A, Normalized delayed release versus time in the presence of 1 mm Cae(open circles) and 2 mm Cae(filled circles). Solid lines were computed by using Equation 1, with A = 0.08,B = 1.0, and n = 3.5, and calcium transients were measured experimentally (normalized to the calcium value at 10 msec in control conditions). B, Delayed release versus normalized [Ca]i for 1 mm Cae (open circles) and 2 mm Cae (filled circles). The solid line is the computed delayed release versus the normalized calcium transient from A. The curves that were calculated for 1 and 2 mm Caeoverlap.
Fig. 10.
Fig. 10.
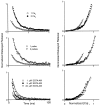
Summary plots of delayed release versus presynaptic calcium levels after parallel fiber stimulation. Shown is normalized delayed release as a function of time (left panels) and as a function of calcium concentration (right panels) in 1 and 2 mm Cae(top), for one and two pulses in 1 mmCae (middle), and after loading with 1, 5, and 20 μm EGTA-AM (bottom). Graphs to theright correspond to graphs on the left, and the same symbols are used. In the bottom right graphthe 20 μm EGTA-AM graph was not included for clarity.Solid curves are computed according to Equation 2, as described in Results.
Fig. 11.
Fig. 11.
Delayed release of neurotransmitter that follows one (left panel) and two (right panel) pulses at 33°C. Shown are phasic EPSCs (top), delayed mEPSCs (middle) in 10 consecutive trials, and mEPSC histograms (bottom). For delayed release trials and for mEPSC histograms the times from 0 to 10 msec (right) or from 0 to 20 msec (left) have been blanked for clarity.

Similar articles

Cited by

References

    1. Atluri PP, Regehr WG. Determinants of the time course of facilitation at the granule cell to Purkinje cell synapse. J Neurosci. 1996;16:5661–5671. - PMC - PubMed
    1. Atluri PP, Regehr WG. Differential calcium dependence of facilitation and asynchronous release at a cerebellar synapse. Soc Neurosci Abstr. 1997;23:467.11.
    1. Barbour B, Keller BU, Llano I, Marty A. Prolonged presence of glutamate during excitatory synaptic transmission to cerebellar Purkinje cells. Neuron. 1994;12:1331–1343. - PubMed
    1. Barrett EF, Stevens CF. The kinetics of transmitter release at the frog neuromuscular junction. J Physiol (Lond) 1972;227:691–708. - PMC - PubMed
    1. Bertram R, Sherman A, Stanley EF. Single-domain/bound calcium hypothesis of transmitter release and facilitation. J Neurophysiol. 1996;75:1919–1931. - PubMed

Publication types

MeSH terms

LinkOut - more resources