. 1998 Oct 1;512 ( Pt 1)(Pt 1):61-73.
doi: 10.1111/j.1469-7793.1998.061bf.x.

N- and L-type calcium channel involvement in depolarization-induced suppression of inhibition in rat hippocampal CA1 cells

Affiliations

N- and L-type calcium channel involvement in depolarization-induced suppression of inhibition in rat hippocampal CA1 cells

R A Lenz et al. J Physiol. .

Abstract

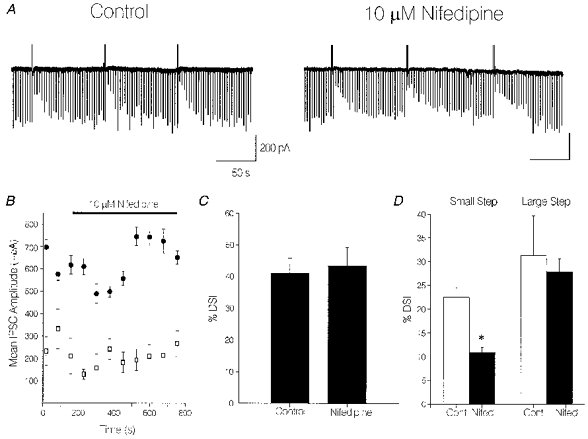
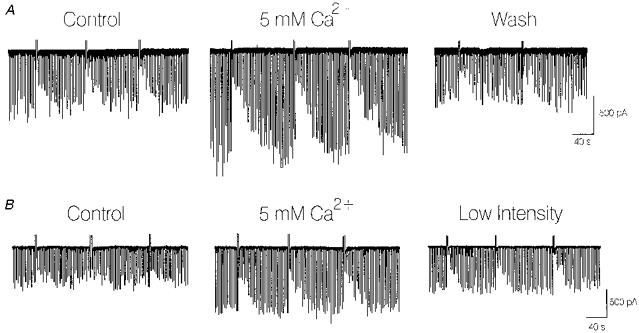
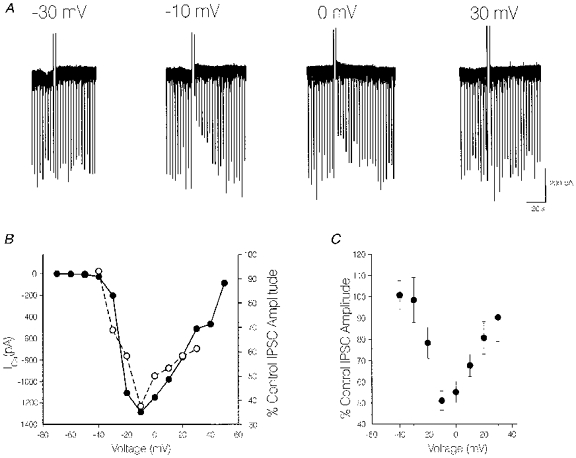
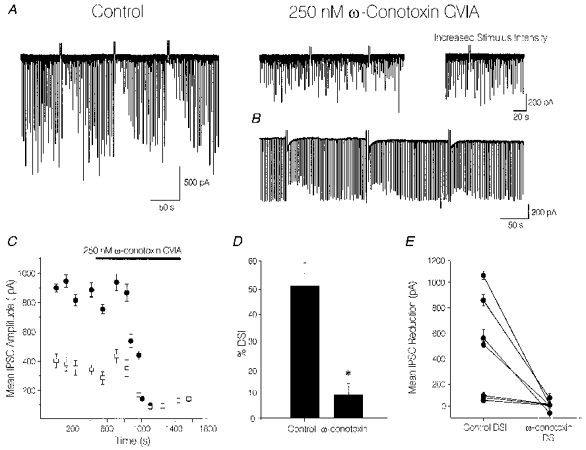
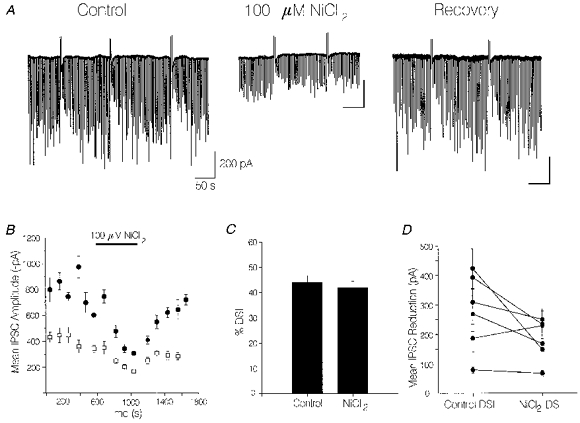
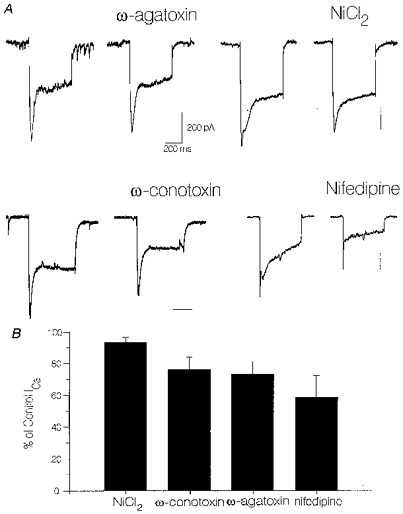
1. We investigated depolarization-induced suppression of inhibition (DSI) under whole-cell voltage clamp in CA1 pyramidal neurons of rat hippocampal slices. DSI, a transient reduction in monosynaptic evoked GABAAergic IPSCs lasting for approximately 1 min, was induced by depolarizing the pyramidal cell to -10 or 0 mV for 1 or 2 s. 2. Raising extracellular Ca2+ concentration increased DSI, and varying the DSI-inducing voltage step showed that the voltage dependence of DSI was like that of high-voltage-activated Ca2+ channels. 3. The P- and Q-type Ca2+ channel blocker omega-agatoxin TK (200 nM and 1 microM) and the R- and T-type Ca2+ channel blocker Ni2+ (100 microM) reduced IPSCs without reducing DSI. 4. The specific N-type Ca2+ channel antagonist omega-conotoxin GVIA (250 nM) reduced IPSC amplitudes and almost completely abolished DSI. 5. Blocking L-type Ca2+ channels with nifedipine (10 microM) had no effect on IPSCs or DSI induced by our standard protocol, but reduced DSI induced by the unclamped Na+- and Ca2+-dependent spikes that occurred when 2(triethylamino)-N-(2,6-dimethylphenyl)acetamide (QX-314) was omitted from the recording pipette solution. 6. Although intracellular Ca2+ stores were not measured, DSI was not affected by cyclopiazonic acid (CPA, 20-40 microM), a blocker of Ca2+ uptake into intracellular stores. 7. We conclude that DSI is initiated by Ca2+ influx through N- and, under certain conditions, L-type Ca2+ channels.


Figures

Figure 6
Figure 6. Under some conditions L-type Ca2+ channels can play a role in DSI
A, nifedipine (10 μm), which blocks L-type Ca2+ channels, did not block DSI induced by large voltage steps and did not affect IPSC amplitudes. Calibration values for left panel apply also to right panel. B, typical time course of an experiment showing the lack of effect of nifedipine on DSI. Symbols as for Fig. 3C. C, group data (n = 8) show that DSI in nifedipine was not different from DSI in control conditions (P > 0.2) using our standard DSI-inducing protocol. D, group data from cells in which DSI was elicited by a small voltage step (to −25 or −20 mV) and recorded with electrodes lacking QX-314 show that DSI was significantly reduced by 10 μm nifedipine (* P = 0.03, n = 4), whereas DSI elicited by large voltage steps (to −5 or 0 mV) in the same cells was not significantly affected by nifedipine (P > 0.4, n = 4).
Figure 3
Figure 3. Activation of neither P- nor Q-type Ca2+ channels is necessary for DSI
A, the selective P-type Ca2+ channel blocker ω-agatoxin TK (200 nm) greatly reduced the IPSC amplitudes, but did not block DSI. Calibration values in left panel of A apply also to right panel and B. B, preincubation of slices in 1 μmω-agatoxin TK to block completely both P- and Q-type Ca2+ channels did not block DSI. The cells from the preincubated slices were recorded with CsCH3SO3-filled electrodes (see Methods), and thus the IPSCs were outward going in this experiment. For consistency of display, this trace was inverted, so the currents appear downward. C, time course of a representative experiment with ω-agatoxin where • represents the mean amplitude of the 8IPSCs immediately preceding the DSI step and □ the mean amplitude of the 5 IPSCs immediately following the DSI step (symbols as for Fig. 3C). D, group data (n = 8) showing that %DSI in control conditions is significantly less (* P = 0.001) than in the presence of ω-agatoxin TK. E, the absolute reduction in IPSC amplitude during DSI is similar in control conditions and in the presence of ω-agatoxin TK (P > 0.05).
Figure 1
Figure 1. DSI is sensitive to changes in [Ca2+]o
A, a 1 s depolarizing step from the holding potential of −70 mV to −10 mV (here and in subsequent figures indicated by upward deflection) resulted in DSI (41 %) with 2.5 mm Ca2+ and 2.0 mm Mg2+ in the extracellular solution (left trace). Perfusion with a solution containing high Ca2+ (5 mm) and nominally 0 mm Mg2+ greatly increased DSI (to 70 %) and IPSC amplitudes in the same cell (middle trace). The effect of high Ca2+ on DSI and IPSC amplitude was reversible upon wash (right trace; 43 % DSI). B, another cell in which DSI was small under control conditions (left trace), but was still greatly enhanced by raising extracellular [Ca2+] (middle trace). DSI was still enhanced after lowering the stimulus intensity in high [Ca2+]o to elicit IPSCs of similar amplitude to those in control conditions (right trace).
Figure 2
Figure 2. The voltage dependence of DSI parallels that of Ca2+ channel activation
A, CA1 pyramidal cells were voltage clamped at −70 mV and stepped for 1 s to the voltages indicated. Voltage steps to −30 mV did not result in DSI, whereas steps to −10 and 0 mV resulted in marked DSI. Interestingly, large voltage steps (+30 mV) approaching the Ca2+ equilibrium potential did not cause any DSI. Traces in A are from the same cell. B, plots of peak Ca2+ current (ICa) (○) vs. voltage and of % IPSC amplitude vs. the induction voltage step (•) from the same cell are superimposed. The voltage dependences of ICa and DSI are very similar, suggesting that the amount of DSI is related to the postsynaptic Ca2+ influx during the voltage step. Because there is little or no DSI following very large voltage steps (where there is little or no Ca2+ influx), DSI cannot be due to the voltage step per se. C, the voltage dependence of DSI averaged from 6 cells is shown. Here and in subsequent figures symbols and error bars indicate means and s.e.m., respectively.
Figure 4
Figure 4. N-type Ca2+ channel activation is necessary for DSI
A, at concentrations that selectively block N-type Ca2+ channels, ω-conotoxin GVIA (250 nm) greatly reduced the IPSC amplitude and virtually abolished DSI. Increasing the stimulus amplitude to recover partially the IPSC amplitude did not recover DSI. The mean IPSC, which was reduced to 210 pA by ω-conotoxin, was 358pA with increased stimulus intensity. B, ω-conotoxin can cause a progressive block of DSI prior to reducing IPSC amplitudes. ω-Conotoxin was applied at a slow rate that allowed a progressive reduction of DSI from 38% after the first depolarizing step to 26 % after the third. IPSC amplitudes were not altered over this period. Continued application of ω-conotoxin to this cell resulted in a complete block of DSI and a greater reduction in IPSC amplitude (not shown). C, the time course of a typical experiment with ω-conotoxin demonstrates that the toxin rapidly reduced IPSC amplitude as well as DSI. Symbols as for Fig. 3C. D, control DSI was significantly larger than the DSI in ω-conotoxin (* P = 0.005, n = 7). E, the absolute reduction in IPSC amplitude was profoundly greater during DSI in control conditions than in the presence of ω-conotoxin.
Figure 5
Figure 5. Activation of neither R- nor T-type Ca2+ channels is necessary for DSI
A, NiCl2 (100 μm), which blocks R- and T-type Ca2+ channels, did not affect DSI, but did reduce IPSC amplitudes. This suggests that either R- or T-type Ca2+ channels are involved in release of GABA onto CA1 pyramidal cells. Calibration values in left panel apply also to middle and right panels. B, typical time course of the effects of NiCl2 on IPSC amplitude and lack of effect on DSI. The effects of NiCl2 were reversible on washout. Symbols as for Fig. 3C. C, group data (n = 6) show that DSI in control conditions was not different from that in the presence of NiCl2 (P > 0.1). D, absolute reduction in IPSC amplitude during DSI in the presence of NiCl2 was smaller than that in control conditions, presumably because NiCl2 reduced the IPSC amplitude.
Figure 7
Figure 7. Effects of Ca2+ channel blockers on ICa
A, voltage steps to −10 or 0 mV for 500 ms elicited inward currents that were Cd2+ or leak subtracted. Cd2+ was applied at the end of the experiments, and occasionally the cell was lost prior to its application. In these cells leak subtraction only was possible. The peak current in control conditions and after drug administration for the cell was measured. Calibration values in top left panel apply to all other panels in A. B, the averaged data for each channel blocker are displayed in the histogram as a percentage of the control Ca2+ current. NiCl2, 93.2 ± 3.3 %, n = 6; ω-conotoxin GVIA, 76.2 ± 8.0 %, n = 7; ω-agatoxin TK, 73.3 ± 8.0 %, n = 5; nifedipine, 58.9 ± 13.4 %, n = 7.

Similar articles

Cited by

References

    1. Alger BE, Pitler TA. Retrograde signaling at GABAA-receptor synapses in the mammalian CNS. Trends in Neurosciences. 1995;18:333–340. 10.1016/0166-2236(95)93923-L. - DOI - PubMed
    1. Alger BE, Pitler TA, Wagner JJ, Martin LA, Morishita W, Kirov SA, Lenz RA. Retrograde signalling in depolarization-induced suppression of inhibition in rat hippocampal CA1 cells. The Journal of Physiology. 1996;496:197–209. - PMC - PubMed
    1. Andrade R. Blockade of neurotransmitter-activated K+ conductance by QX-314 in the rat hippocampus. European Journal of Pharmacology. 1991;199:259–262. 10.1016/0014-2999(91)90467-5. - DOI - PubMed
    1. Avery RB, Johnston D. Multiple channel types contribute to the low-voltage-activated calcium current in hippocampal CA3 pyramidal neurons. Journal of Neuroscience. 1996;16:5567–5582. - PMC - PubMed
    1. Berridge MJ, Irvine RF. Inositol trisphosphate, a novel second messenger in cellular signal transduction. Nature. 1984;312:315–321. - PubMed

Publication types

MeSH terms

LinkOut - more resources