Positional cloning of ZNF217 and NABC1: genes amplified at 20q13.2 and overexpressed in breast carcinoma
- PMID: 9671742
- PMCID: PMC21140
- DOI: 10.1073/pnas.95.15.8703
Positional cloning of ZNF217 and NABC1: genes amplified at 20q13.2 and overexpressed in breast carcinoma
Abstract
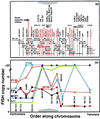
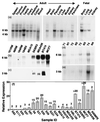
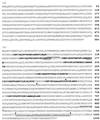
We report here the molecular cloning of an approximately 1-Mb region of recurrent amplification at 20q13.2 in breast cancer and other tumors and the delineation of a 260-kb common region of amplification. Analysis of the 1-Mb region produced evidence for five genes, ZNF217, ZNF218, and NABC1, PIC1L (PIC1-like), CYP24, and a pseudogene CRP (Cyclophillin Related Pseudogene). ZNF217 and NABC1 emerged as strong candidate oncogenes and were characterized in detail. NABC1 is predicted to encode a 585-aa protein of unknown function and is overexpressed in most but not all breast cancer cell lines in which it was amplified. ZNF217 is centrally located in the 260-kb common region of amplification, transcribed in multiple normal tissues, and overexpressed in all cell lines and tumors in which it is amplified and in two in which it is not. ZNF217 is predicted to encode alternately spliced, Kruppel-like transcription factors of 1,062 and 1,108 aa, each having a DNA-binding domain (eight C2H2 zinc fingers) and a proline-rich transcription activation domain.
Figures


Similar articles
-
Cloning of BCAS3 (17q23) and BCAS4 (20q13) genes that undergo amplification, overexpression, and fusion in breast cancer.Genes Chromosomes Cancer. 2002 Dec;35(4):311-7. doi: 10.1002/gcc.10121. Genes Chromosomes Cancer. 2002. PMID: 12378525
-
ZNF217 suppresses cell death associated with chemotherapy and telomere dysfunction.Hum Mol Genet. 2005 Nov 1;14(21):3219-25. doi: 10.1093/hmg/ddi352. Epub 2005 Oct 3. Hum Mol Genet. 2005. PMID: 16203743
-
Amplification of zinc finger gene 217 (ZNF217) and cancer: when good fingers go bad.Biochim Biophys Acta. 2007 Jun;1775(2):333-40. doi: 10.1016/j.bbcan.2007.05.001. Epub 2007 May 22. Biochim Biophys Acta. 2007. PMID: 17572303 Review.
-
ZNF217, a candidate breast cancer oncogene amplified at 20q13, regulates expression of the ErbB3 receptor tyrosine kinase in breast cancer cells.Oncogene. 2010 Oct 7;29(40):5500-10. doi: 10.1038/onc.2010.289. Epub 2010 Jul 26. Oncogene. 2010. PMID: 20661224 Free PMC article.
-
ZNF217: An Oncogenic Transcription Factor and Potential Therapeutic Target for Multiple Human Cancers.Cancer Manag Res. 2024 Jan 18;16:49-62. doi: 10.2147/CMAR.S431135. eCollection 2024. Cancer Manag Res. 2024. PMID: 38259608 Free PMC article. Review.
Cited by
-
Identification of genes directly regulated by the oncogene ZNF217 using chromatin immunoprecipitation (ChIP)-chip assays.J Biol Chem. 2007 Mar 30;282(13):9703-9712. doi: 10.1074/jbc.M611752200. Epub 2007 Jan 26. J Biol Chem. 2007. PMID: 17259635 Free PMC article.
-
Frequency, prognostic impact, and subtype association of 8p12, 8q24, 11q13, 12p13, 17q12, and 20q13 amplifications in breast cancers.BMC Cancer. 2006 Oct 13;6:245. doi: 10.1186/1471-2407-6-245. BMC Cancer. 2006. PMID: 17040570 Free PMC article.
-
Telomere position effect and silencing of transgenes near telomeres in the mouse.Mol Cell Biol. 2006 Mar;26(5):1865-78. doi: 10.1128/MCB.26.5.1865-1878.2006. Mol Cell Biol. 2006. PMID: 16479005 Free PMC article.
-
DNA copy number changes in young gastric cancer patients with special reference to chromosome 19.Br J Cancer. 2003 Jun 16;88(12):1914-9. doi: 10.1038/sj.bjc.6600969. Br J Cancer. 2003. PMID: 12799636 Free PMC article.
-
Specific recognition of ZNF217 and other zinc finger proteins at a surface groove of C-terminal binding proteins.Mol Cell Biol. 2006 Nov;26(21):8159-72. doi: 10.1128/MCB.00680-06. Epub 2006 Aug 28. Mol Cell Biol. 2006. PMID: 16940172 Free PMC article.
References
-
- Muleris M, Almeida A, Gerbault-Seureau M, Malfoy B, Dutrillaux B. Genes Chromosomes Cancer. 1994;10:160–170. - PubMed
-
- Gaudray P, Szepetowski P, Escot C, Birnbaum D, Theillet C. Mutat Res. 1992;276:317–328. - PubMed
-
- Borg A, Baldetorp B, Ferno M, Olsson H, Ryden S, Sigurdsson H. Oncogene. 1991;6:137–143. - PubMed
Publication types
MeSH terms
Substances
Associated data
- Actions
- Actions
Grants and funding
LinkOut - more resources
Full Text Sources
Other Literature Sources
Medical
Molecular Biology Databases
Research Materials
Miscellaneous

