. 1998 Jul 15;18(14):5264-74.
doi: 10.1523/JNEUROSCI.18-14-05264.1998.

The activity of a highly promiscuous AP-1 element can be confined to neurons by a tissue-selective repressive element

Affiliations

The activity of a highly promiscuous AP-1 element can be confined to neurons by a tissue-selective repressive element

J R Weber et al. J Neurosci. .

Abstract

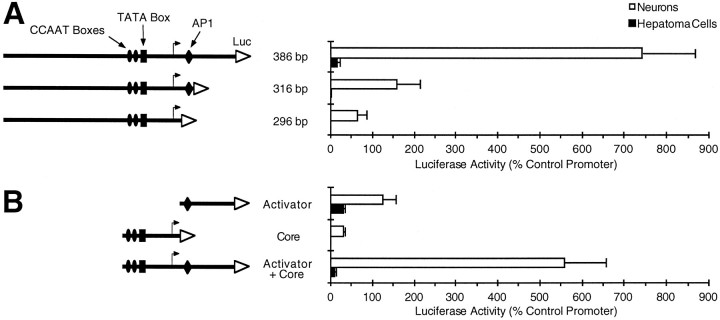
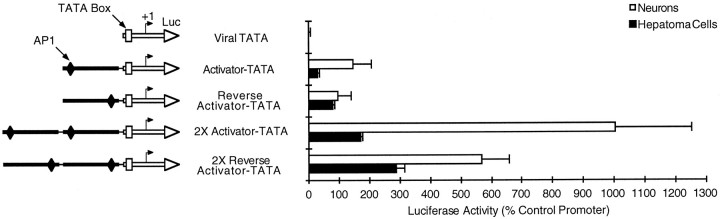
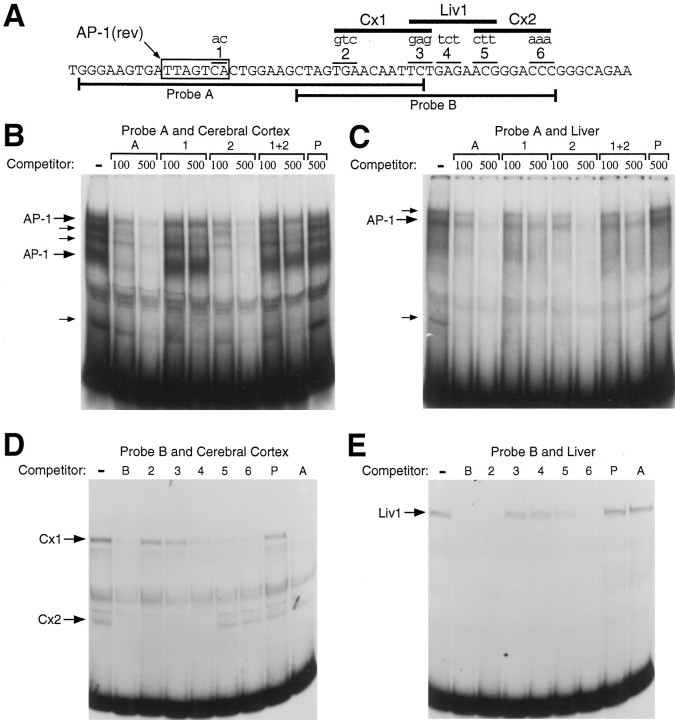
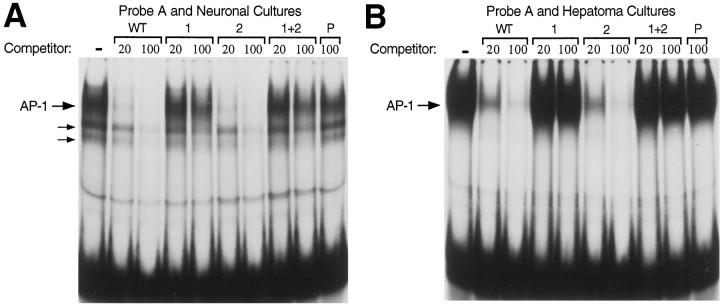
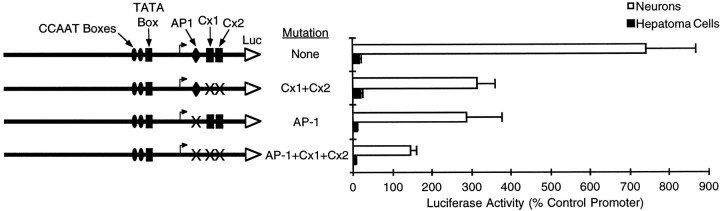
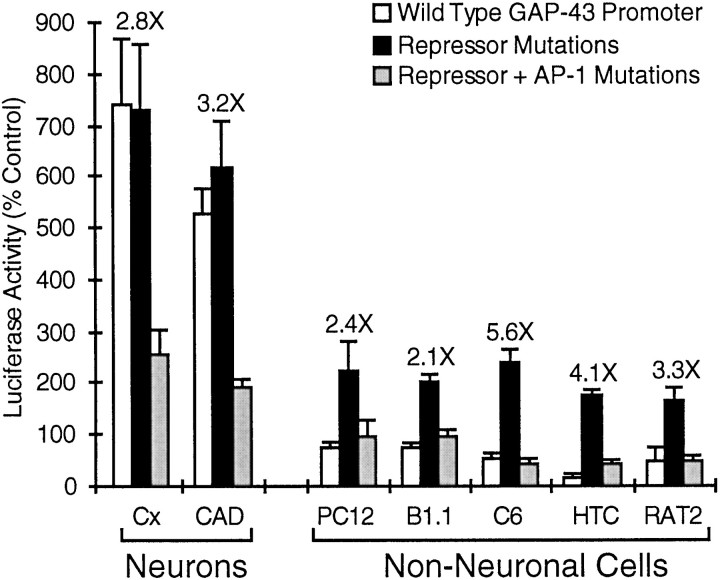
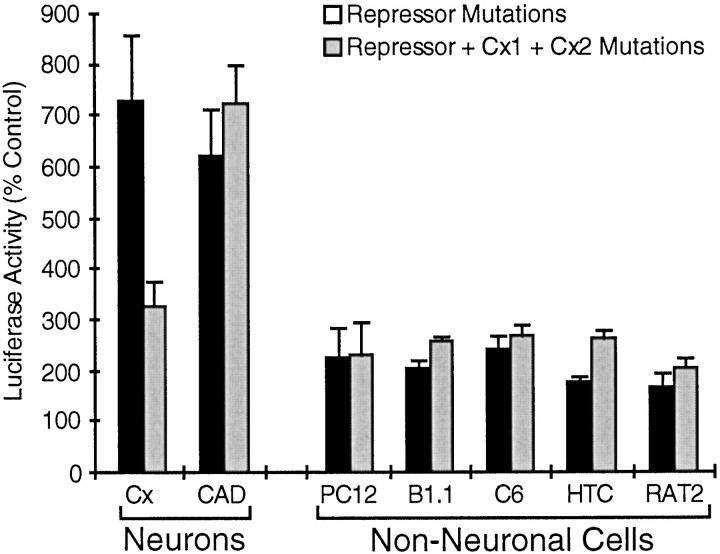
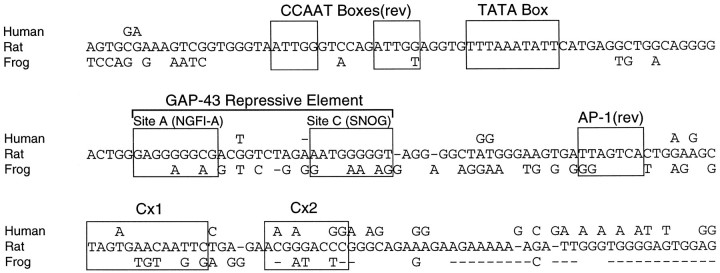
Tissue-specific gene transcription can be determined by the use of either positive-acting or negative-acting DNA regulatory elements. We have analyzed a promoter from the growth-associated protein 43 (GAP-43) gene and found that it uses both of these mechanisms to achieve its high degree of neuron-specific activity. Two novel transcription factor binding sites, designated Cx1 and Cx2, drive promoter activity in neurons from developing cerebral cortex but not in several other cell types. The promoter also contains an activator protein 1 (AP-1) site that contributes to activity in neurons. The AP-1 site can drive promoter activity in a wide range of non-neuronal cells that express little or no endogenous GAP-43, but only in the absence of a tissue-specific repressive element located downstream of the GAP-43 TATA box. These findings suggest that the GAP-43 repressive element plays an important role in allowing AP-1 signaling pathways to modulate activity of the GAP-43 gene in neurons, without also causing inappropriate activation by AP-1 transcription factors in other cell types.


Figures

Fig. 1.
Fig. 1.
The activity of a neuron-specific 386 bp GAP-43 promoter depends on a synergy between a core promoter and a downstream activator region. The rat GAP-43 promoter constructs shown schematically were tested for the ability to drive the expression of a luciferase reporter gene (Luc) in primary neuronal cultures or hepatoma cells. The effect of deletions from the promoter’s 3′ end are shown inA, whereas a demonstration of the synergistic effect between the activator region and the core promoter is shown inB. Luciferase activity for each construct is normalized to the activity of a modified adenovirus promoter (see Materials and Methods). SEMs are based on at least three experiments. The neuronal cultures are dissociated cells from rat embryonic cerebral cortex treated with an antimitotic agent to kill the majority of non-neuronal cells. CCAAT, TATA, andAP-1 consensus sequences are labeled. The bent arrow designates the most 5′ transcription start site, which is located ∼45 bp downstream of the TATA box (Nedivi et al., 1992;Ortoft et al., 1993). The RNase protection assays performed by Ortoft and coworkers (1993) on human transcripts indicate that there are more dominant transcription start sites located ∼70 and 100 bp downstream of the TATA box (the transcription start sites for the rat promoter are very likely to be the same as for human, because the rat and human promoter sequences are highly conserved in this region). The 96 bp sequence that we refer to as the core promoter includes sequences from 6 bp upstream of the CCAAT boxes to 59 bp downstream of the TATA box. The 90 bp activator region includes the AP-1 consensus sequence.
Fig. 2.
Fig. 2.
The activator region is likely to contain transcription factor binding sites. The activator region that was defined in the previous figure was placed upstream of a TATA box and transcription start site that were borrowed from the adenovirus E1b promoter. As indicated in the schematics, the activator region was inserted as one or two copies in either the forward or reverse orientation. Promoter activity in neurons and hepatoma cells is reported in the graph (same as Fig. 1).
Fig. 3.
Fig. 3.
Identification of protein binding sites in the AP-1/Cx activator region. A, The DNA sequences used to make probes for EMSAs are indicated by bars below the sequence for the first 60 bp of the 90 bp AP-1/Cx activator region. The AP-1 consensus sequence is boxed, and mutations introduced into the probes are shown in lower case letters. The sequence alteration used to mutate the AP-1 site ( TGACTAA to GTACTAA on the antisense strand) has been demonstrated previously to disrupt AP-1 binding and activity in another promoter (Lee et al., 1991). The location of novel putative transcription factor binding sites are indicated by barslabeled as Cx1, Liv1, and Cx2.B, EMSAs with radiolabeled probe A and nuclear extract from postnatal day 5 rat cerebral cortex. The first lane contains only the radiolabeled probe and nuclear extract, whereas the additional lanes include either a 100- or 500-fold molar excess of unlabeled wild-type probe A or probe A with mutations 1, 2, or the combination of mutations 1 and 2. P stands for a polylinker DNA with no similarity to the probe A sequence. If a mutation affects protein binding, then the competitor with that mutation should compete less effectively or not at all. AP-1 specific-bands are labeled withlarge arrows, and smaller arrows indicate additional sequence specific bands that do not appear to depend on the AP-1 sequence. C, EMSAs with probe A and liver nuclear extract. D, EMSAs with probe B and nuclear extract from postnatal cerebral cortex. Numbers designate probe B with mutations 2, 3, 4, 5, or 6. Competitor probes were used at a 500-fold molar excess. Cx1 refers to the binding site defined by mutations 2 and 3, whereas Cx2 refers to the binding site defined by mutations 5 and 6. E, EMSAs with probe B and liver nuclear extract. Competitors were used at a 50-fold molar excess in this case. Liv1 refers to the binding site defined by mutations 3, 4, and 5.
Fig. 4.
Fig. 4.
AP-1-specific binding in protein extracts from neuronal and hepatoma cultures. A, EMSAs with probe A of Figure 3 and whole-cell extract from cultures of embryonic rat cerebral cortex. B, Same as A except with whole-cell extracts from hepatoma cell cultures. Nuclear extracts from the neuronal and hepatoma cell cultures gave similar results (data not shown).
Fig. 5.
Fig. 5.
Transcription factor binding sites in the AP-1/Cx activator region are required for the majority of the activity of the 386 bp GAP-43 promoter. Promoter constructs with mutations in proposed transcription factor binding sites (AP-1, Cx1, Cx2) were tested for the ability to drive expression of a reporter gene in neurons and hepatoma cells (same as Fig. 1). The AP-1, Cx1, and Cx2 binding sites were altered by using mutations 1, 2, and 6, respectively, of Figure3.
Fig. 6.
Fig. 6.
Evaluation of the activity of the AP-1/Cx activator region in a wide range of cell types. We have shown previously that mutation of a repressive element located downstream of the TATA box of the 386 bp GAP-43 promoter results in an increase in promoter activity in non-neuronal cells (Weber and Skene, 1997). Here we compare the activity of the wild-type 386 bp GAP-43 promoter, the GAP-43 promoter with mutations in the previously characterized repressive element, and the GAP-43 promoter with mutations in both the repressive element and the AP-1 site (same AP-1 mutation as Fig. 3). These promoter–reporter gene constructs were tested for activity in primary neuronal cultures (Cx for neuronal cultures from rat embryonic cerebral cortex), a neuronal cell line with high levels of endogenous GAP-43 (CAD cells), and five non-neuronal cell lines: PC12, B1.1, C6, HTC, and RAT2 (discussed in Results). Note that in each of the non-neuronal cell types, mutation of the AP-1 site eliminates most or all of the activity that had been achieved by disruption of the repressive element.
Fig. 7.
Fig. 7.
The Cx1 and Cx2 sites contribute to neuron-specific expression of the GAP-43 promoter. The 386 bp GAP-43 promoter with mutations in the repressive element is compared with the same promoter with additional mutations in the Cx1 and Cx2 sites (same methods as in Fig. 6).
Fig. 8.
Fig. 8.
Comparison of mammalian and amphibian GAP-43 sequences. Human (Ortoft et al., 1993), rat (GenBank accession numberM88356; Nedivi et al., 1992), and Xenopus (GenBank accession number Y09834; submitted by L. H. Schrama, Rudolf Magnus Institute for Neuroscience, Utrecht, The Netherlands) GAP-43 sequences surrounding and downstream of the GAP-43 TATA box are shown. The human and frog sequences are reported only where they deviate from the rat sequence in our alignment. A dash indicates a space inserted to obtain the best alignment. Conservation of the boxed elements is discussed in Results, and consensus sequences that should be read on the complementary strand are marked as reverse (rev).
Fig. 9.
Fig. 9.
Mammalian proteins bind to a potential frog GAP-43 repressive element and AP-1 site. A, Rat and frog repressive element probes for EMSAs are shown withbrackets enclosing an NGFI-A/EGR consensus sequence (Fig. 8, site A) and a purine-rich sequence that overlaps with site C of Figure 8. Sequences in the frog AP-1 probe that are similar to the bracketed regions of the repressive element probes are bracketed and discussed in Results. The AP-1 consensus sequence isboxed and should be read on the strand complementary to the sequence shown. Mutations in the EMSA probes are shown inlower case letters, and the wild-type sequences they replace are overlined or underlined.B, EMSAs with hepatoma whole-cell extracts and radiolabeled frog repressive element probe. Competitor probes were used at a 200-fold molar excess relative to the radiolabeled probe. Thehollow arrow marks the relative mobility of the SNOG element-specific band that binds to the rat repressive element, as we have shown previously (Weber and Skene, 1997), but an equivalent band was not obtained with the frog repressive element. The SNAP-25 SNOG competitor probe contains a high-affinity binding site for the SNOG element, but does not contain an NGFI-A/EGR consensus sequence.C, EMSAs with radiolabeled frog AP-1 probe and hepatoma whole-cell extracts. The sequence of the rat AP-1 competitor probe is given in Figure 3A. Note that repressive element-specific rather than AP-1-specific bands were obtained (see Results and Discussion). We verified the identity of each of the probes in question (see Materials and Methods) and conducted several repeat experiments to confirm these unexpected results. An independently synthesized batch of the frog AP-1 probe yielded the same results.D, Same as C except that the radiolabeled frog AP-1 probe contains mutations mA and mC and the magnesium concentration has been optimized to 6 mm rather than 1 mm (see Materials and Methods). When the EMSA inC was conducted at 6 mm magnesium rather than 1 mm, the repressive element binding was less intense, but we still could not detect any AP-1-specific bands (data not shown). Competitors were used at a 50-fold or 250-fold excess relative to the radiolabeled probe.

Similar articles

Cited by

References

    1. Anchan RM, Drake DP, Haines CF, Gerwe EA, LaMantia AS. Disruption of local retinoid-mediated gene expression accompanies abnormal development in the mammalian olfactory pathway. J Comp Neurol. 1997;379:171–184. - PubMed
    1. Anton ES, Hadjiargyrou M, Patterson PH, Matthew WD. CD9 plays a role in Schwann cell migration in vitro. J Neurosci. 1995;15:584–595. - PMC - PubMed
    1. Bassuk AG, Leiden JM. A direct physical association between ETS and AP-1 transcription factors in normal human T cells. Immunity. 1995;3:223–237. - PubMed
    1. Benda P, Lightbody J, Sato G, Levine L, Sweet W. Differentiated rat glial cell strain in tissue culture. Science. 1968;161:370–371. - PubMed
    1. Brasier AR, Fortin JJ. Nonisotopic assays for reporter gene activity. In: Ausubel FM, Brent R, Kingston RE, Moore DD, Seidman JG, Smith JA, Struhl K, editors. Current protocols in molecular biology. Wiley; New York: 1995. pp. 9.7.12–9.7.14. - PubMed

Publication types