. 1998 Jun 18;393(6686):648-59.
doi: 10.1038/31405.

Structure of an HIV gp120 envelope glycoprotein in complex with the CD4 receptor and a neutralizing human antibody

Affiliations

Structure of an HIV gp120 envelope glycoprotein in complex with the CD4 receptor and a neutralizing human antibody

P D Kwong et al. Nature. .

Abstract

The entry of human immunodeficiency virus (HIV) into cells requires the sequential interaction of the viral exterior envelope glycoprotein, gp120, with the CD4 glycoprotein and a chemokine receptor on the cell surface. These interactions initiate a fusion of the viral and cellular membranes. Although gp120 can elicit virus-neutralizing antibodies, HIV eludes the immune system. We have solved the X-ray crystal structure at 2.5 A resolution of an HIV-1 gp120 core complexed with a two-domain fragment of human CD4 and an antigen-binding fragment of a neutralizing antibody that blocks chemokine-receptor binding. The structure reveals a cavity-laden CD4-gp120 interface, a conserved binding site for the chemokine receptor, evidence for a conformational change upon CD4 binding, the nature of a CD4-induced antibody epitope, and specific mechanisms for immune evasion. Our results provide a framework for understanding the complex biology of HIV entry into cells and should guide efforts to intervene.


Figures
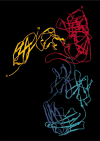
Figure 1
Figure 1
Overall structure. The ribbon diagram shows gp120 in red, the N-terminal two domains of CD4 in yellow, and the Fab 17b in light blue (light chain) and purple (heavy chain). The side chain of Phe43 on CD4 is shown. The prominent CDR3 loop of the 17b heavy chain is evident in this orientation. Although the complete N and C termini of gp120 are missing, the positions of the gp120 termini are consistent with the proposal that gp41, and hence the viral membrane, is located towards the top of the diagram. This would position the target membrane at the diagram base. The vertical dimension of gp120 in this orientation is roughly 50Å. Perpendicular views of gp120 are shown in Figs 2 and 4. Drawn with RIBBONS.
Figure 2
Figure 2
Structure of core gp120. In a–c, the orientation of gp120 is related to Fig. 1 by a 90° rotation about a vertical axis. Thus the viral membrane would be oriented above, the target membrane below, and the C-terminal tail of CD4 would be coming out of the page. In this view, we describe the left portion of core gp120 as the inner domain, the right portion as the outer domain, and the 4-stranded sheet at the bottom left of gp120 as the bridging sheet. The bridging sheet (β3, β2, β21, β20) can be seen packing primarily over the inner domain, although some surface residues of the outer domain, such as Phe382, reach in to form part of its hydrophobic core. a, Ribbon diagram. α-Helices are depicted in red and β-strands in salmon, except for strand β15 (yellow), which makes an antiparallel β-sheet alignment with strand C″ of CD4. Connections are shown in grey, except for the disordered V4 loop (dashed line) connecting β18 and β19. Selected parts of the structure are labelled. b, Topology diagram. The diagram is arranged to coincide with the orientation of a, c, Helices are shown as corkscrews and labelled α1–α5. β-Strands are shown as arrows: black and labelled represent the 25 β-strands of core gp120; grey and unlabelled represent the continuation of hydrogen bonding across a sheet; white and labelled represents the C″ strand of CD4. Spatial proximity between neighbouring strands implies main-chain hydrogen bonding. Loops are labelled ℒA–ℒF and V1–V5. Labels for loops with high sequence variability are circled. Assignments of secondary structure were made with the Kabsch and Sander algorithm, except for β4 and β8, which are both interrupted mid-strand by side-chain-backbone hydrogen bonds, β9, β15 and β25a, all of which have angles or hydrogen bonds that are slightly non-standard, and α4, which hydrogen bonds as a 310 helix, with the final residue in β conformation. c, Stereo plot of an α-carbon trace. Every 10th Cα is marked with a filled circle, and every 20th residue is labelled. Disulphide connections are depicted as ball and stick. The ordered residues 90–396 and 410–492 are shown. d, Structure-based sequence alignment. The sequences are shown of HIV-1 B (core gp120 from clade B, strain HXBc2 used in these studies), C (HIV-1 clade C, strain UG268A2), O (HIV-1 clade O, strain ANT70), HIV-2 (strain ROD), and SIV (African green monkey isolate, clone GRI-1). The secondary-structure assignments are shown as arrows and cylinders, with a cross denoting residues that are disordered in the present structure. The ‘gars’ sequence at the N terminus and the ‘gag’ sequence in the V1/V2 and V3 loops are consequences of the gp120 truncation. Solvent accessibility is indicated for each residue by an open circle if the fractional solvent accessibility is greater than 0.4, a half-filled circle if it is 0.1 to 0.4, and a filled circle if it is less than 0.1. Sequence variability among primate immunodeficiency viruses is indicated below the solvent accessibility by the number of horizontal hash marks: 1, residues conserved among all primate immunodeficiency viruses; 2, conserved among all HIV-1 isolates; 3, moderate variation among HIV-1 isolates; and 4, significant variability among HIV-1 isolates. In assessing conservation, all single atom changes were permitted as well as larger substitutions if the character of the side chain was conserved (for example, K to R or F to L). N-linked glycosylation is indicated by ‘m’ for the high-mannose additions and ‘c’ for the complex additions in mammalian cells. Residues of gp120 in direct contact with CD4 are indicated by an asterisk. Direct contact is a more restrictive criterion of interaction than the often-used loss of solvent-accessible surface; residues of gp120 that have lost solvent-accessible surface but are not in direct contact include 123,124,126, 257, 278, 282, 364, 471, 475, 476 and 477. Panels a and b were drawn with MOLSCRIPT (P. J. Kraulis).
Figure 2
Figure 2
Structure of core gp120. In a–c, the orientation of gp120 is related to Fig. 1 by a 90° rotation about a vertical axis. Thus the viral membrane would be oriented above, the target membrane below, and the C-terminal tail of CD4 would be coming out of the page. In this view, we describe the left portion of core gp120 as the inner domain, the right portion as the outer domain, and the 4-stranded sheet at the bottom left of gp120 as the bridging sheet. The bridging sheet (β3, β2, β21, β20) can be seen packing primarily over the inner domain, although some surface residues of the outer domain, such as Phe382, reach in to form part of its hydrophobic core. a, Ribbon diagram. α-Helices are depicted in red and β-strands in salmon, except for strand β15 (yellow), which makes an antiparallel β-sheet alignment with strand C″ of CD4. Connections are shown in grey, except for the disordered V4 loop (dashed line) connecting β18 and β19. Selected parts of the structure are labelled. b, Topology diagram. The diagram is arranged to coincide with the orientation of a, c, Helices are shown as corkscrews and labelled α1–α5. β-Strands are shown as arrows: black and labelled represent the 25 β-strands of core gp120; grey and unlabelled represent the continuation of hydrogen bonding across a sheet; white and labelled represents the C″ strand of CD4. Spatial proximity between neighbouring strands implies main-chain hydrogen bonding. Loops are labelled ℒA–ℒF and V1–V5. Labels for loops with high sequence variability are circled. Assignments of secondary structure were made with the Kabsch and Sander algorithm, except for β4 and β8, which are both interrupted mid-strand by side-chain-backbone hydrogen bonds, β9, β15 and β25a, all of which have angles or hydrogen bonds that are slightly non-standard, and α4, which hydrogen bonds as a 310 helix, with the final residue in β conformation. c, Stereo plot of an α-carbon trace. Every 10th Cα is marked with a filled circle, and every 20th residue is labelled. Disulphide connections are depicted as ball and stick. The ordered residues 90–396 and 410–492 are shown. d, Structure-based sequence alignment. The sequences are shown of HIV-1 B (core gp120 from clade B, strain HXBc2 used in these studies), C (HIV-1 clade C, strain UG268A2), O (HIV-1 clade O, strain ANT70), HIV-2 (strain ROD), and SIV (African green monkey isolate, clone GRI-1). The secondary-structure assignments are shown as arrows and cylinders, with a cross denoting residues that are disordered in the present structure. The ‘gars’ sequence at the N terminus and the ‘gag’ sequence in the V1/V2 and V3 loops are consequences of the gp120 truncation. Solvent accessibility is indicated for each residue by an open circle if the fractional solvent accessibility is greater than 0.4, a half-filled circle if it is 0.1 to 0.4, and a filled circle if it is less than 0.1. Sequence variability among primate immunodeficiency viruses is indicated below the solvent accessibility by the number of horizontal hash marks: 1, residues conserved among all primate immunodeficiency viruses; 2, conserved among all HIV-1 isolates; 3, moderate variation among HIV-1 isolates; and 4, significant variability among HIV-1 isolates. In assessing conservation, all single atom changes were permitted as well as larger substitutions if the character of the side chain was conserved (for example, K to R or F to L). N-linked glycosylation is indicated by ‘m’ for the high-mannose additions and ‘c’ for the complex additions in mammalian cells. Residues of gp120 in direct contact with CD4 are indicated by an asterisk. Direct contact is a more restrictive criterion of interaction than the often-used loss of solvent-accessible surface; residues of gp120 that have lost solvent-accessible surface but are not in direct contact include 123,124,126, 257, 278, 282, 364, 471, 475, 476 and 477. Panels a and b were drawn with MOLSCRIPT (P. J. Kraulis).
Figure 3
Figure 3
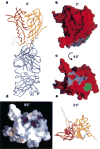
CD4-gp120 interactions. a, Ribbon diagram of gp120 (red) binding to CD4 (yellow). Residue Phe43 of CD4 is also depicted reaching into the heart of gp120. From this orientation, the recessed nature of the gp120 binding pocket is evident. b, Electron density in the Phe 43 cavity. The 2FoFc electron density map at 2.5 Å, 1.1 Σ contour, is shown in blue. The gp120 model is depicted in red with the CD4 model in yellow (carbon atoms), blue (nitrogen atoms), and red (oxygen atoms). The orientation is the same as in a. The foreground has been clipped for clarity, removing the overlying β24–α5 connection. In the upper middle region lies the central unidentified density. At the bottom, Phe43 of CD4 reaches up to contact the cavity. Moving clockwise round the cavity, the gp120 residues are Trp427 (with its indole ring partially clipped by foreground slabbing), Trp 112, Val255, Thr257, Glu370 (packing under the Phe43 ring), Ile371 and Asp368 (partially clipped in the bottom right corner). Hydrophobic residues lining the back of the cavity can be partially seen around the central unidentified density. c, Electrostatic surfaces of CD4 and gp120. The electrostatic potential is shown at the solvent-accessible surface, which is coloured according to the local electrostatic potential, ranging from dark blue (most positive) to deep red (most negative). The slight puffiness of the surface arises from the enlarged solvent-accessible surface relative to the standard molecular surface. On the right, the gp120 surface is shown in an orientation similar to that in Fig. 2a, c, but rotated ~20° around a vertical axis to depict the recessed binding pocket more clearly. Å thin yellow Cα worm of CD4 is shown to aid in orientation. On the left, the CD4 surface is shown, rotated relative to the gp120 panel by an exact 180° rotation about the vertical axis shown. A thin red Cα worm of gp120 is shown. d, CD4-gp120 contact surface. On the right, the gp120 surface is shown in red, with the surface within 3.5Å of CD4 (surface-to-atom centre distance) in yellow. This effectively creates an imprint of CD4 on the gp120 surface. On the left (180° rotation), the corresponding CD4 surface is shown in yellow, with the gp120 imprint in red. e, CD4-gp120 mutational hot-spots. On the right, the surface of gp120 is shown in red, with the surface highlighted of gp120 residues that have been shown by substitution to affect CD4 binding: cyan, substantial effect-residues 368, 370 and 427; green, moderate effect-residue 457. Also depicted (white) is the surface of the large water-filled cavity at the CD4-gp120 interface. On the left (180° rotation), residues important for gp120 binding are shown on a yellow CD4 surface: cyan, substantial effect-residues 43 and 59; green, moderate effect-residues 29, 35, 44, 46, 47 (ref. ). f, Side-chain/main-chain contribution to the gp120 surface. The surface of gp120 contributed by main-chain atoms (including Cβ) is green, that contributed by side-chain atoms is white, and that contributed by the Cα of glycine is brick-red. This orientation is the same as the right panel of c-e and in g, and allows for direct comparison of the CD4-gp120 contact surface. A striking surface concentration of main-chain atoms is seen in the regions corresponding to the CD4 imprint. g, Sequence variability mapped to the gp120 surface. The sequence variability among primate immunodeficiency viruses (Fig. 2d) is mapped onto the gp120 surface. A sliding scale of white (conserved) to brick-red (highly variable) is shown. Carbohydrate residues are also shown: blue, N-acetylglucosamine and fucose residues in the structure; purple, Asn-proximal N-acetylglucosamines modelled at residues 88, 230, 241, 356, 397 406, 462. Much of the carbohydrate (22 residues) is hidden on the back side of the outer domain. h, Phe43 cavity. The surface of the Phe43 cavity is in blue, buried in the heart of gp120.ACaworm representation of gp120 (red) shows in green the three stretches that are incorrect by secondary-structure prediction: the ℒB loop, bending around the top of the cavity, parts of β20–β21 just below the cavity, and strand β15, slightly right of the cavity. The orientation shown here is the same as for the gp120 surfaces in c–g. i, The CD4–gp120 interface. This schematic representation of the entire interface shows six discrete segments of gp120 (solid black lines) interacting with CD4 (double lines). For orientation, secondary structural elements are labelled, as are representative contact residues from each segment of gp120. Arrows indicate main-chain direction. The side chain of Phe43 is also shown. The orientation shown is similar to that in a and b. j, gp120 contacts around Phe43 and Arg 59 of CD4. Residues on gp120 involved in direct contact with Phe43 or Arg 59 are shown. Electrostatic interactions are depicted as dashed lines. Hydrophobic interactions are found between Phe43 (CD4) and Trp427, Glu 370, Gly473and Ile 371 (all from gp120) and between Arg 59 (CD4) and Val 430 (gp120). The orientation is similar to that in a, b and i, but has been rotated for clarity. Side chains of Phe43 and Arg 59, as well as those portions of gp120 sidechains that interact with these crucial CD4 residues, are drawn as bold lines. Panel a was drawn with RIBBONS, b with program O, and b–g with GRASP.
Figure 3
Figure 3
CD4-gp120 interactions. a, Ribbon diagram of gp120 (red) binding to CD4 (yellow). Residue Phe43 of CD4 is also depicted reaching into the heart of gp120. From this orientation, the recessed nature of the gp120 binding pocket is evident. b, Electron density in the Phe 43 cavity. The 2FoFc electron density map at 2.5 Å, 1.1 Σ contour, is shown in blue. The gp120 model is depicted in red with the CD4 model in yellow (carbon atoms), blue (nitrogen atoms), and red (oxygen atoms). The orientation is the same as in a. The foreground has been clipped for clarity, removing the overlying β24–α5 connection. In the upper middle region lies the central unidentified density. At the bottom, Phe43 of CD4 reaches up to contact the cavity. Moving clockwise round the cavity, the gp120 residues are Trp427 (with its indole ring partially clipped by foreground slabbing), Trp 112, Val255, Thr257, Glu370 (packing under the Phe43 ring), Ile371 and Asp368 (partially clipped in the bottom right corner). Hydrophobic residues lining the back of the cavity can be partially seen around the central unidentified density. c, Electrostatic surfaces of CD4 and gp120. The electrostatic potential is shown at the solvent-accessible surface, which is coloured according to the local electrostatic potential, ranging from dark blue (most positive) to deep red (most negative). The slight puffiness of the surface arises from the enlarged solvent-accessible surface relative to the standard molecular surface. On the right, the gp120 surface is shown in an orientation similar to that in Fig. 2a, c, but rotated ~20° around a vertical axis to depict the recessed binding pocket more clearly. Å thin yellow Cα worm of CD4 is shown to aid in orientation. On the left, the CD4 surface is shown, rotated relative to the gp120 panel by an exact 180° rotation about the vertical axis shown. A thin red Cα worm of gp120 is shown. d, CD4-gp120 contact surface. On the right, the gp120 surface is shown in red, with the surface within 3.5Å of CD4 (surface-to-atom centre distance) in yellow. This effectively creates an imprint of CD4 on the gp120 surface. On the left (180° rotation), the corresponding CD4 surface is shown in yellow, with the gp120 imprint in red. e, CD4-gp120 mutational hot-spots. On the right, the surface of gp120 is shown in red, with the surface highlighted of gp120 residues that have been shown by substitution to affect CD4 binding: cyan, substantial effect-residues 368, 370 and 427; green, moderate effect-residue 457. Also depicted (white) is the surface of the large water-filled cavity at the CD4-gp120 interface. On the left (180° rotation), residues important for gp120 binding are shown on a yellow CD4 surface: cyan, substantial effect-residues 43 and 59; green, moderate effect-residues 29, 35, 44, 46, 47 (ref. ). f, Side-chain/main-chain contribution to the gp120 surface. The surface of gp120 contributed by main-chain atoms (including Cβ) is green, that contributed by side-chain atoms is white, and that contributed by the Cα of glycine is brick-red. This orientation is the same as the right panel of c-e and in g, and allows for direct comparison of the CD4-gp120 contact surface. A striking surface concentration of main-chain atoms is seen in the regions corresponding to the CD4 imprint. g, Sequence variability mapped to the gp120 surface. The sequence variability among primate immunodeficiency viruses (Fig. 2d) is mapped onto the gp120 surface. A sliding scale of white (conserved) to brick-red (highly variable) is shown. Carbohydrate residues are also shown: blue, N-acetylglucosamine and fucose residues in the structure; purple, Asn-proximal N-acetylglucosamines modelled at residues 88, 230, 241, 356, 397 406, 462. Much of the carbohydrate (22 residues) is hidden on the back side of the outer domain. h, Phe43 cavity. The surface of the Phe43 cavity is in blue, buried in the heart of gp120.ACaworm representation of gp120 (red) shows in green the three stretches that are incorrect by secondary-structure prediction: the ℒB loop, bending around the top of the cavity, parts of β20–β21 just below the cavity, and strand β15, slightly right of the cavity. The orientation shown here is the same as for the gp120 surfaces in c–g. i, The CD4–gp120 interface. This schematic representation of the entire interface shows six discrete segments of gp120 (solid black lines) interacting with CD4 (double lines). For orientation, secondary structural elements are labelled, as are representative contact residues from each segment of gp120. Arrows indicate main-chain direction. The side chain of Phe43 is also shown. The orientation shown is similar to that in a and b. j, gp120 contacts around Phe43 and Arg 59 of CD4. Residues on gp120 involved in direct contact with Phe43 or Arg 59 are shown. Electrostatic interactions are depicted as dashed lines. Hydrophobic interactions are found between Phe43 (CD4) and Trp427, Glu 370, Gly473and Ile 371 (all from gp120) and between Arg 59 (CD4) and Val 430 (gp120). The orientation is similar to that in a, b and i, but has been rotated for clarity. Side chains of Phe43 and Arg 59, as well as those portions of gp120 sidechains that interact with these crucial CD4 residues, are drawn as bold lines. Panel a was drawn with RIBBONS, b with program O, and b–g with GRASP.
Figure 4
Figure 4
Neutralizing antibody 17b-gp120 interface. a, Cα worm diagram of Fab 17b and gp120. The Fab 17b (blue) is shown binding to gp120, which has been coloured red (inner domain), pink (bridging sheet and V1/V2 stem), orange (outer domain) and green (V3 base). The orientation is the same as in Fig. 2a, c. b, Contact surface and V3 loop. The surface of gp120 is in red, with any surface within 3.5 Å of Fab 17b (surface-to-atom centre) coloured blue and the surface of the V3 base coloured green. The orientation is the same as in a. c, Contact surface and V3 loop. The same as b but rotated by 90° around a horizontal axis better to depict the 17b epitope. d, The electrostatic potential is shown at the solvent-accessible surface, which is coloured according to the local electrostatic potential, ranging from dark blue (most positive) to red (negative). The electrostatic colouring is on the same scale as that in Fig. 3c. The surface that corresponds to the 17b epitope is the most electropositive region of the molecule. The V3 loop is truncated here, but sequence analysis shows it to be positively charged overall. e, Cα-worm diagram of gp120. The gp120 is coloured according to the scheme in a. The orientation is the same as in c and d: that is, 90° from a. Figure was made with GRASP.
Figure 5
Figure 5
Diagram of gp120 initiation of fusion. A single monomer of core gp120 is depicted (red) in an orientation similar to that in Fig. 2a, c. The ‘3’ symbolizes the 3fold axis, from which gp41 interacts with the gp120 N and C termini to generate the functional oligomer. In the initial state of gp120 (on the surface of a virion), the V1/ V2 loops (salmon) are shown partially occluding the CD4-binding site. Following CD4 binding (now at a target cell, though above the glycocalyx), a conformational change is depicted as an inner/outer domain shift, with the purple circle denoting the formation of the Phe43 cavity. This conformational change strains the interactions at the N and C termini of gp120 with the rest of the oligomer, priming the CD4-bound gp120 core. In the next step (directly adjacent to the target membrane), the chemokine receptor binds to the bridging sheet and the V3 loop (in green; bottom left and right, respectively, of gp120), causing an orientational shift of core gp120 relative to the oligomer. This triggers further changes, which ultimately lead to the fusion of the viral and target membranes.

Comment in

Similar articles

Cited by

References

    1. Barre-Sinoussi F, et al. Isolation of a T-lymphotropic retrovirus from a patient at risk for acquired immunodeficiency syndrome (AIDS) Science. 1983;220:868–871. - PubMed
    1. Gallo RC, et al. Frequent detection and isolation of cytopathic retroviruses (HTLV-III) from patients with AIDS and at risk for AIDS. Science. 1984;224:500–503. - PubMed
    1. Kowalski ML, et al. Functional regions of the envelope glycoprotein of human immunodeficiency virus type 1. Science. 1987;237:1351–1355. - PubMed
    1. Lu M, Blackow S, Kim P. A trimeric structural domain of the HIV-1 transmembrane glycoprotein. Nature Struct Biol. 1995;2:1075–1082. - PubMed
    1. Starcich BR, et al. Identification and characterization of conserved and variable regions of the envelope gene HTLV-III/LAV, the retrovirus of AIDS. Cell. 1986;45:637–648. - PubMed

Publication types

MeSH terms

Associated data