

HERG-like K+ channels in microglia
- PMID: 9607936
- PMCID: PMC2217149
- DOI: 10.1085/jgp.111.6.781
HERG-like K+ channels in microglia
Abstract
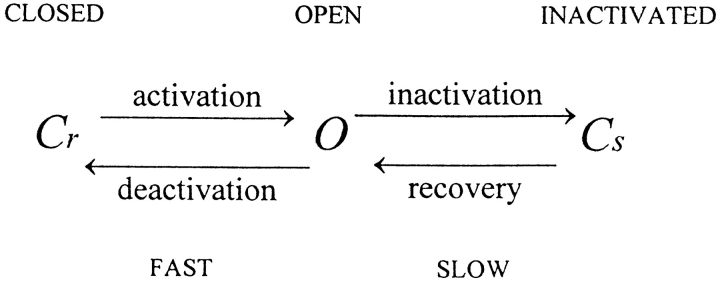
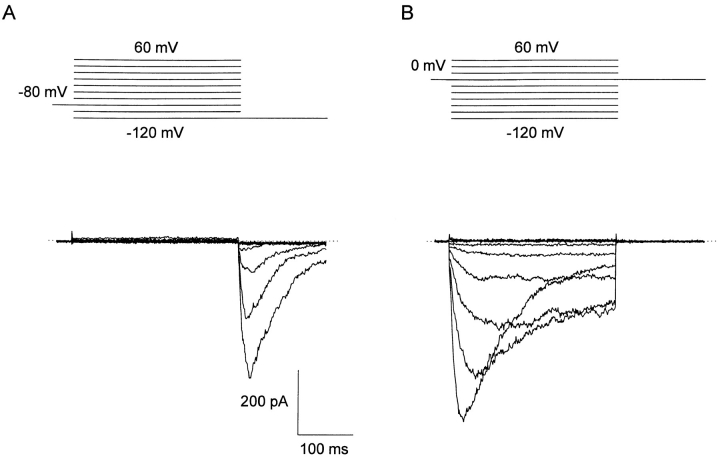
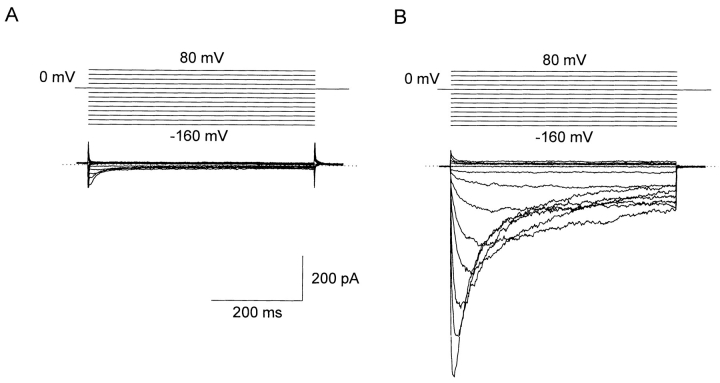
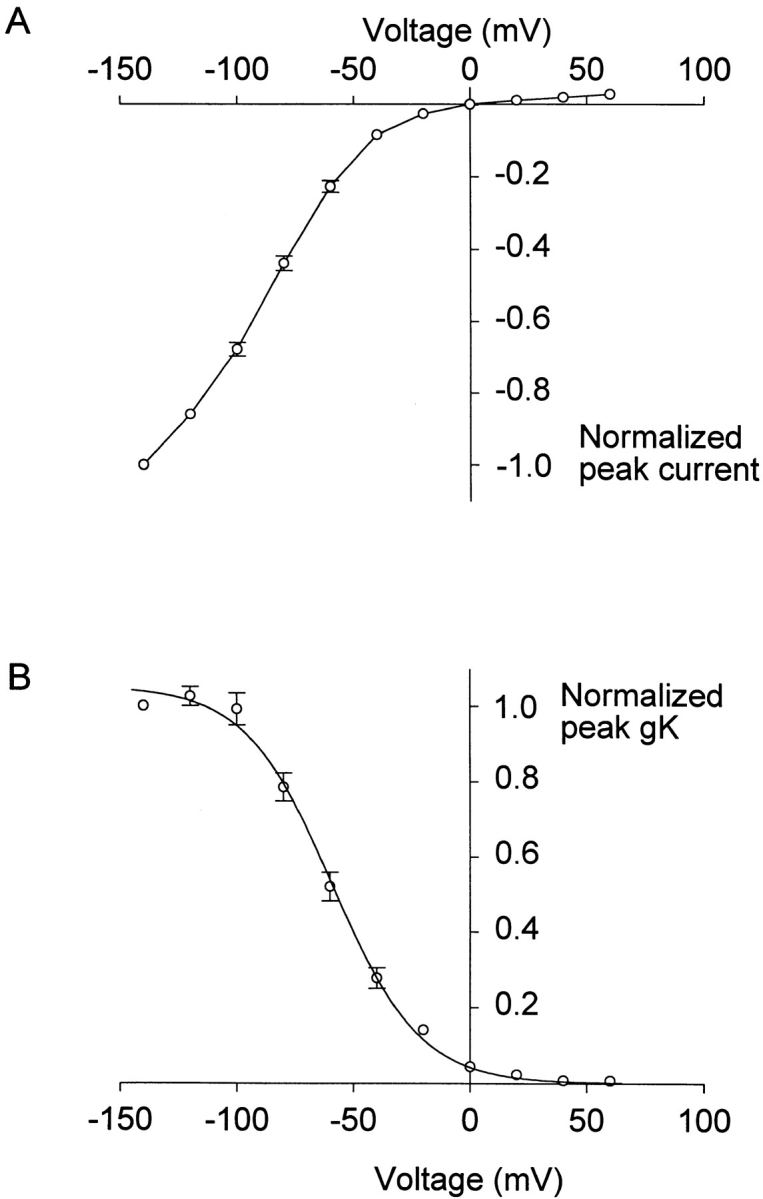
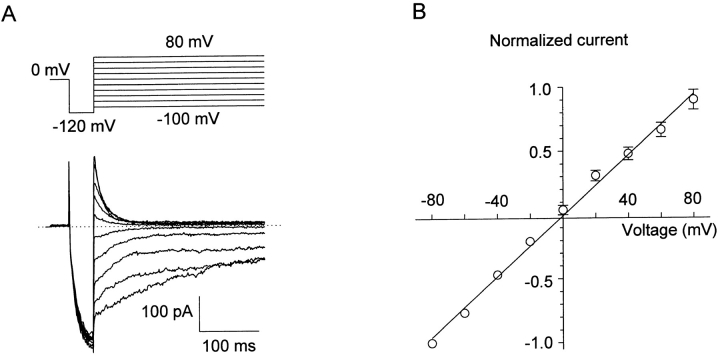
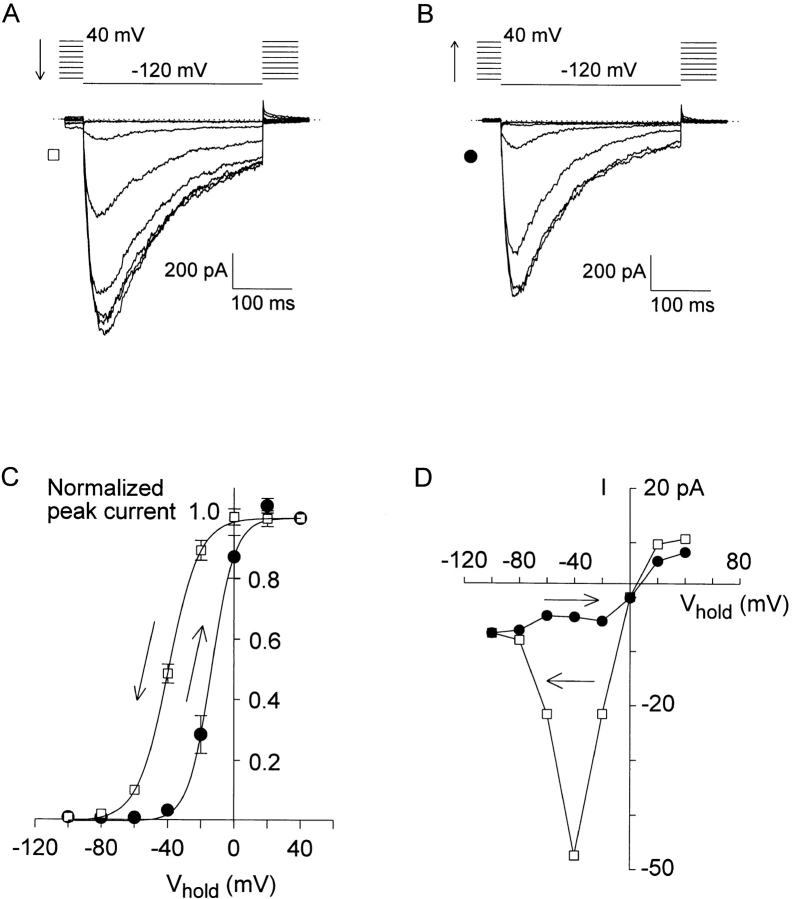
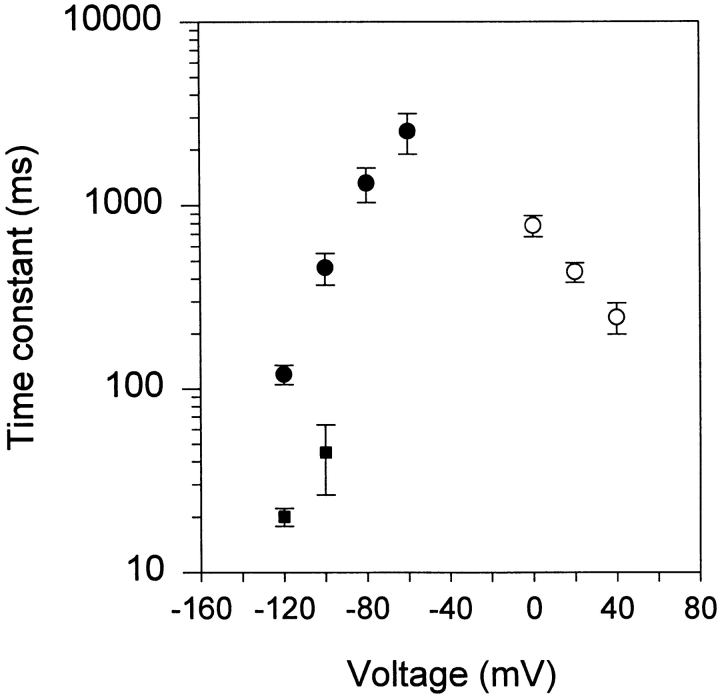
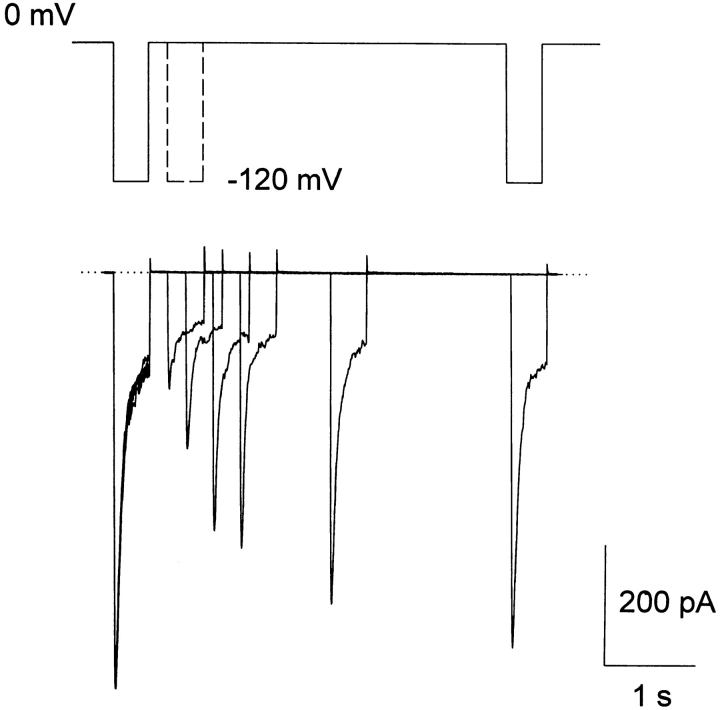
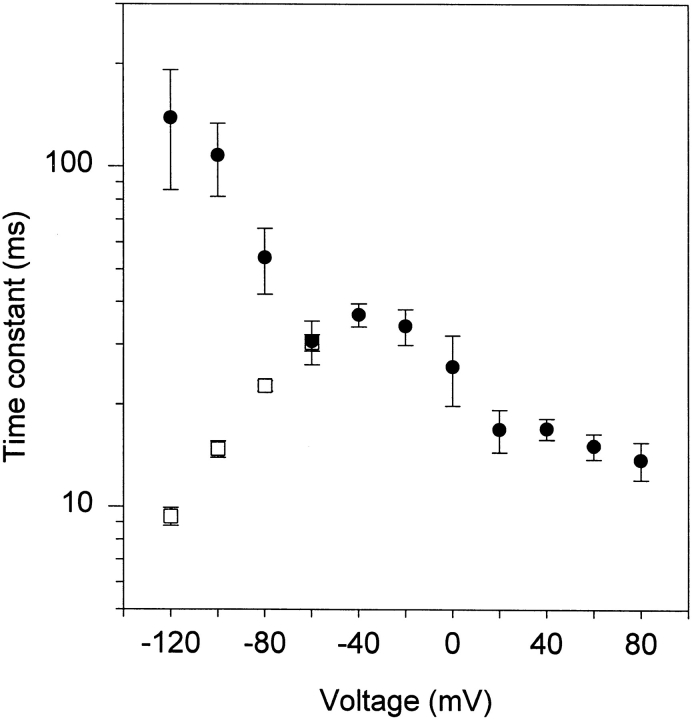
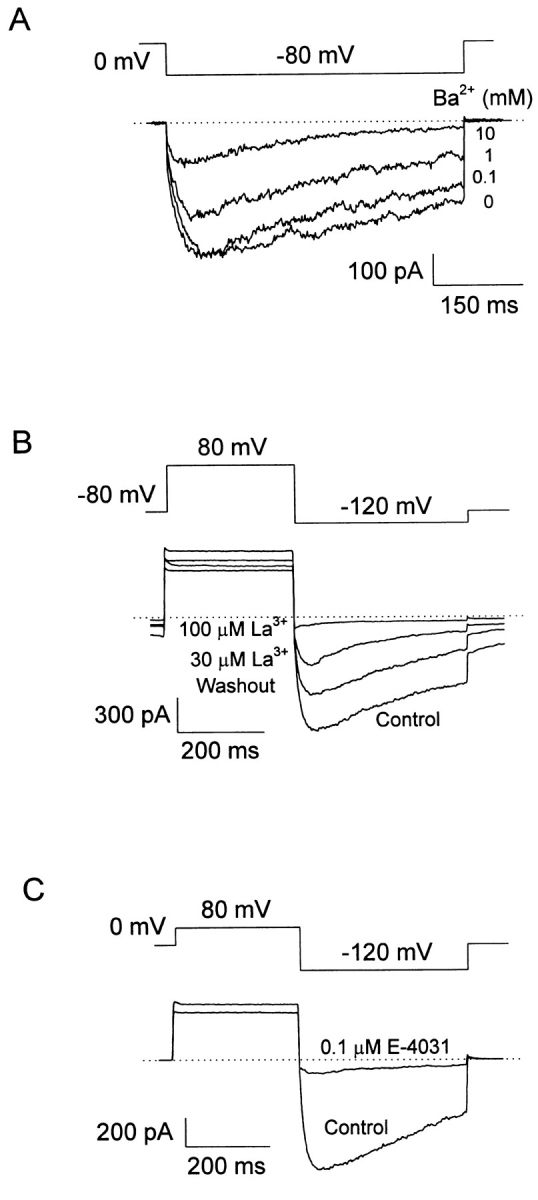
A voltage-gated K+ conductance resembling that of the human ether-à-go-go-related gene product (HERG) was studied using whole-cell voltage-clamp recording, and found to be the predominant conductance at hyperpolarized potentials in a cell line (MLS-9) derived from primary cultures of rat microglia. Its behavior differed markedly from the classical inward rectifier K+ currents described previously in microglia, but closely resembled HERG currents in cardiac muscle and neuronal tissue. The HERG-like channels opened rapidly on hyperpolarization from 0 mV, and then decayed slowly into an absorbing closed state. The peak K+ conductance-voltage relation was half maximal at -59 mV with a slope factor of 18.6 mV. Availability, assessed by a hyperpolarizing test pulse from different holding potentials, was more steeply voltage dependent, and the midpoint was more positive (-14 vs. -39 mV) when determined by making the holding potential progressively more positive than more negative. The origin of this hysteresis is explored in a companion paper (Pennefather, P.S., W. Zhou, and T.E. DeCoursey. 1998. J. Gen. Physiol. 111:795-805). The pharmacological profile of the current differed from classical inward rectifier but closely resembled HERG. Block by Cs+ or Ba2+ occurred only at millimolar concentrations, La3+ blocked with Ki = approximately 40 microM, and the HERG-selective blocker, E-4031, blocked with Ki = 37 nM. Implications of the presence of HERG-like K+ channels for the ontogeny of microglia are discussed.
Figures
Similar articles
-
Idiosyncratic gating of HERG-like K+ channels in microglia.J Gen Physiol. 1998 Jun;111(6):795-805. doi: 10.1085/jgp.111.6.795. J Gen Physiol. 1998. PMID: 9607937 Free PMC article.
-
The erg-like potassium current in rat lactotrophs.J Physiol. 1999 Jul 15;518 ( Pt 2)(Pt 2):401-16. doi: 10.1111/j.1469-7793.1999.0401p.x. J Physiol. 1999. PMID: 10381588 Free PMC article.
-
Altered gating of HERG potassium channels by cobalt and lanthanum.Pflugers Arch. 2000 Jun;440(2):264-74. doi: 10.1007/s004240000263. Pflugers Arch. 2000. PMID: 10898527
-
Modulation of rat erg1, erg2, erg3 and HERG K+ currents by thyrotropin-releasing hormone in anterior pituitary cells via the native signal cascade.J Physiol. 2001 Apr 1;532(Pt 1):143-63. doi: 10.1111/j.1469-7793.2001.0143g.x. J Physiol. 2001. PMID: 11283231 Free PMC article.
-
A HERG-like K+ channel in rat F-11 DRG cell line: pharmacological identification and biophysical characterization.J Physiol. 1996 Oct 1;496 ( Pt 1)(Pt 1):13-23. doi: 10.1113/jphysiol.1996.sp021661. J Physiol. 1996. PMID: 8910192 Free PMC article.
Cited by
-
Separation of M-like current and ERG current in NG108-15 cells.Br J Pharmacol. 1999 Jul;127(5):1213-23. doi: 10.1038/sj.bjp.0702642. Br J Pharmacol. 1999. PMID: 10455268 Free PMC article.
-
BeKm-1 is a HERG-specific toxin that shares the structure with ChTx but the mechanism of action with ErgTx1.Biophys J. 2003 May;84(5):3022-36. doi: 10.1016/S0006-3495(03)70028-9. Biophys J. 2003. PMID: 12719233 Free PMC article.
-
Targeting effector memory T cells with a selective peptide inhibitor of Kv1.3 channels for therapy of autoimmune diseases.Mol Pharmacol. 2005 Apr;67(4):1369-81. doi: 10.1124/mol.104.008193. Epub 2005 Jan 21. Mol Pharmacol. 2005. PMID: 15665253 Free PMC article.
-
Cardiolipotoxicity, Inflammation, and Arrhythmias: Role for Interleukin-6 Molecular Mechanisms.Front Physiol. 2019 Jan 7;9:1866. doi: 10.3389/fphys.2018.01866. eCollection 2018. Front Physiol. 2019. PMID: 30666212 Free PMC article. Review.
-
Hysteresis in voltage-gated channels.Channels (Austin). 2017 Mar 4;11(2):140-155. doi: 10.1080/19336950.2016.1243190. Epub 2016 Sep 30. Channels (Austin). 2017. PMID: 27689426 Free PMC article. Review.
References
-
- Almers, W. 1971. The Potassium Permeability of Frog Muscle Membrane. Ph.D. dissertation. University of Rochester, Rochester, NY.
-
- Arcangeli A, Rosati B, Cherubini A, Crociani O, Fontana L, Ziller C, Wanke E, Olivotto M. HERG- and IRK-like inward rectifier currents are sequentially expressed during neuronal development of neural crest cells and their derivatives. Eur J Neurosci. 1997;9:2596–2604. - PubMed
-
- Banati RB, Hoppe D, Gottmann K, Kreutzberg GW, Kettenmann H. A subpopulation of bone marrow-derived macrophage-like cells shares a unique ion channel pattern with microglia. J Neurosci Res. 1991;30:593–600. - PubMed
-
- Barry PH, Lynch JW. Liquid junction potentials and small cell effects in patch-clamp analysis. J Membr Biol. 1991;121:101–117. - PubMed
Publication types
MeSH terms
Substances
Grants and funding
LinkOut - more resources
Full Text Sources
Other Literature Sources
Research Materials
