

Targeted disruption of fibroblast growth factor (FGF) receptor 2 suggests a role for FGF signaling in pregastrulation mammalian development
- PMID: 9560232
- PMCID: PMC20217
- DOI: 10.1073/pnas.95.9.5082
Targeted disruption of fibroblast growth factor (FGF) receptor 2 suggests a role for FGF signaling in pregastrulation mammalian development
Abstract
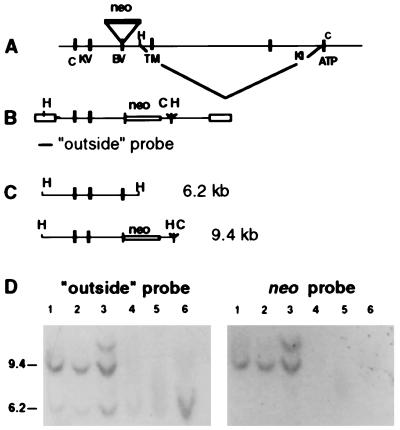
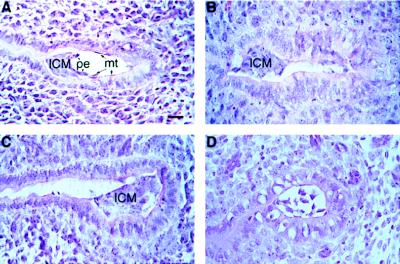
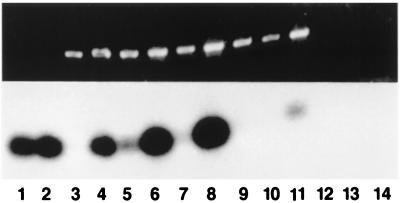
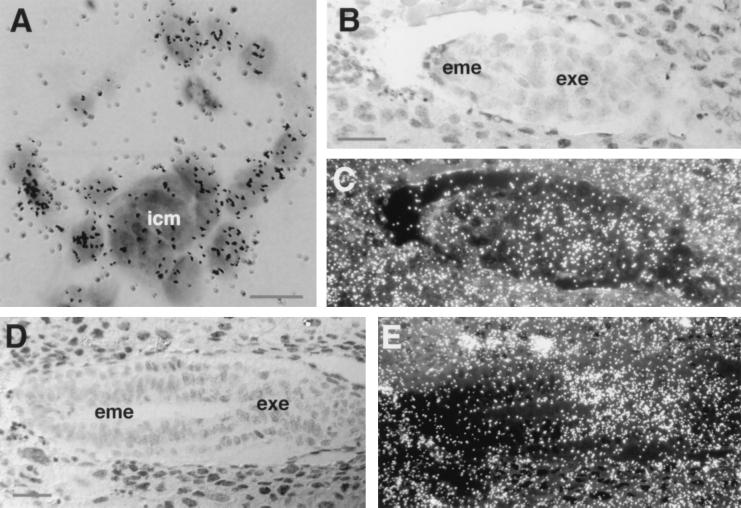
We disrupted the fibroblast growth factor (FGF) receptor 2 (FGFR2) gene by introducing a neo cassette into the IIIc ligand binding exon and by deleting a genomic DNA fragment encoding its transmembrane domain and part of its kinase I domain. A recessive embryonic lethal mutation was obtained. Preimplantation development was normal until the blastocyst stage. Homozygous mutant embryos died a few hours after implantation at a random position in the uterine crypt, with collapsed yolk cavity. Mutant blastocysts hatched, adhered, and formed a layer of trophoblast giant cells in vitro, but after prolonged culture, the growth of the inner cell mass stopped, no visceral endoderm formed, and finally the egg cylinder disintegrated. It follows that FGFR2 is required for early postimplantation development between implantation and the formation of the egg cylinder. We suggest that FGFR2 contributes to the outgrowth, differentiation, and maintenance of the inner cell mass and raise the possibility that this activity is mediated by FGF4 signals transmitted by FGFR2. The role of early FGF signaling in pregastrulation development as a possible adaptation to mammalian (amniote) embryogenesis is discussed.
Figures

Similar articles
-
Fibroblast growth factor receptor 2 (FGFR2)-mediated reciprocal regulation loop between FGF8 and FGF10 is essential for limb induction.Development. 1998 Feb;125(4):753-65. doi: 10.1242/dev.125.4.753. Development. 1998. PMID: 9435295
-
Expression of Fgfr2 in the early mouse embryo indicates its involvement in preimplantation development.Mech Dev. 1999 Jul;85(1-2):167-72. doi: 10.1016/s0925-4773(99)00082-9. Mech Dev. 1999. PMID: 10415357
-
Expression of fibroblast growth factor receptors in peri-implantation mouse embryos.Mol Reprod Dev. 1998 Nov;51(3):254-64. doi: 10.1002/(SICI)1098-2795(199811)51:3<254::AID-MRD4>3.0.CO;2-O. Mol Reprod Dev. 1998. PMID: 9771645
-
Fgfr2 is required for limb outgrowth and lung-branching morphogenesis.Proc Natl Acad Sci U S A. 1999 Oct 12;96(21):11895-9. doi: 10.1073/pnas.96.21.11895. Proc Natl Acad Sci U S A. 1999. PMID: 10518547 Free PMC article.
-
Genetic control of the cell proliferation-differentiation balance in the developing skull vault: roles of fibroblast growth factor receptor signalling pathways.Novartis Found Symp. 2001;232:102-16; discussion 116-21. doi: 10.1002/0470846658.ch8. Novartis Found Symp. 2001. PMID: 11277075 Review.
Cited by
-
Paracrine interactions through FGFR1 and FGFR2 receptors regulate the development of preimplantation mouse chimaeric embryo.Open Biol. 2022 Nov;12(11):220193. doi: 10.1098/rsob.220193. Epub 2022 Nov 16. Open Biol. 2022. PMID: 36382369 Free PMC article.
-
Intercellular interactions, position, and polarity in establishing blastocyst cell lineages and embryonic axes.Cold Spring Harb Perspect Biol. 2012 Nov 1;4(11):a008235. doi: 10.1101/cshperspect.a008235. Cold Spring Harb Perspect Biol. 2012. PMID: 23125013 Free PMC article. Review.
-
The different shades of mammalian pluripotent stem cells.Hum Reprod Update. 2011 Mar-Apr;17(2):254-71. doi: 10.1093/humupd/dmq035. Epub 2010 Aug 12. Hum Reprod Update. 2011. PMID: 20705693 Free PMC article. Review.
-
Genomic screening of fibroblast growth-factor receptor 2 reveals a wide spectrum of mutations in patients with syndromic craniosynostosis.Am J Hum Genet. 2002 Feb;70(2):472-86. doi: 10.1086/338758. Epub 2002 Jan 4. Am J Hum Genet. 2002. PMID: 11781872 Free PMC article.
-
FGF18 is required for normal cell proliferation and differentiation during osteogenesis and chondrogenesis.Genes Dev. 2002 Apr 1;16(7):870-9. doi: 10.1101/gad.965702. Genes Dev. 2002. PMID: 11937494 Free PMC article.
References
-
- Feldman B, Poueymirou W, Papaioannou V E, DeChiare T M, Goldfarb M. Science. 1995;267:246–249. - PubMed
-
- Yamaguchi T P, Harpal K, Henkemeyer M, Rossant J. Genes Dev. 1994;8:3032–3044. - PubMed
-
- Deng C-X, Wynshaw-Boris A, Shen M M, Daugherty C, Ornitz D M, Leder P. Genes Dev. 1994;8:3045–3057. - PubMed
-
- Mansour S L, Goddard J M, Capecchi M R. Development (Cambridge, UK) 1993;117:13–28. - PubMed
-
- Cohn M J, Izpisua-Belmonte J C, Abud H, Heath J K, Tickle C. Cell. 1995;80:739–746. - PubMed
Publication types
MeSH terms
Substances
LinkOut - more resources
Full Text Sources
Other Literature Sources
Molecular Biology Databases
Miscellaneous
