Production of medakafish chimeras from a stable embryonic stem cell line
- PMID: 9520425
- PMCID: PMC19895
- DOI: 10.1073/pnas.95.7.3679
Production of medakafish chimeras from a stable embryonic stem cell line
Abstract
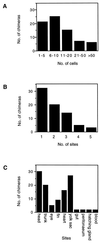
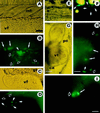
Embryonic stem (ES) cell lines provide a unique tool for introducing targeted or random genetic alterations through gene replacement, insertional mutagenesis, and gene addition because they offer the possibility for in vitro selection for the desired, but extremely rare, recombinant genotypes. So far only mouse blastocyst embryos are known to have the competence to give rise to such ES cell lines. We recently have established a stable cell line (Mes1) from blastulae of the medakafish (Oryzias latipes) that shows all characteristics of mouse ES cells in vitro. Here, we demonstrate that Mes1 cells also have the competence for chimera formation; 90% of host blastulae transplanted with Mes1 cells developed into chimeric fry. This high frequency was not compromised by cryostorage or DNA transfection of the donor cells. The Mes1 cells contributed to numerous organs derived from all three germ layers and differentiated into various types of functional cells, most readily observable in pigmented chimeras. These features suggest the possibility that Mes1 cells may be a fish equivalent of mouse ES cells and that medaka can be used as another system for the application of the ES cell technology.
Figures


Similar articles
-
Efficiency of cell culture derivation from blastula embryos and of chimera formation in the medaka (Oryzias latipes) depends on donor genotype and passage number.Dev Genes Evol. 1998 Dec;208(10):595-602. doi: 10.1007/s004270050220. Dev Genes Evol. 1998. PMID: 9811979
-
Retention of the developmental pluripotency in medaka embryonic stem cells after gene transfer and long-term drug selection for gene targeting in fish.Transgenic Res. 2004 Feb;13(1):41-50. doi: 10.1023/b:trag.0000017172.71391.fa. Transgenic Res. 2004. PMID: 15070074
-
Activation of the mouse Oct4 promoter in medaka embryonic stem cells and its use for ablation of spontaneous differentiation.Mech Dev. 2004 Jul;121(7-8):933-43. doi: 10.1016/j.mod.2004.03.028. Mech Dev. 2004. PMID: 15210197
-
Pluripotent stem cells--model of embryonic development, tool for gene targeting, and basis of cell therapy.Anat Histol Embryol. 2002 Jun;31(3):169-86. doi: 10.1046/j.1439-0264.2002.00388.x. Anat Histol Embryol. 2002. PMID: 12479360 Review.
-
Generation, culture, and differentiation of human embryonic stem cells for therapeutic applications.Mol Ther. 2006 Jan;13(1):5-14. doi: 10.1016/j.ymthe.2005.09.008. Epub 2005 Oct 20. Mol Ther. 2006. PMID: 16242999 Review.
Cited by
-
Interordinal chimera formation between medaka and zebrafish for analyzing stem cell differentiation.Stem Cells Dev. 2012 Aug 10;21(12):2333-41. doi: 10.1089/scd.2011.0630. Epub 2012 Feb 7. Stem Cells Dev. 2012. PMID: 22204449 Free PMC article.
-
Establishment, characterization, and virus susceptibility of a new marine cell line from red spotted grouper (Epinephelus akaara).Mar Biotechnol (NY). 2007 May-Jun;9(3):370-6. doi: 10.1007/s10126-006-7165-3. Epub 2007 Mar 7. Mar Biotechnol (NY). 2007. PMID: 17342554
-
Establishment of a normal medakafish spermatogonial cell line capable of sperm production in vitro.Proc Natl Acad Sci U S A. 2004 May 25;101(21):8011-6. doi: 10.1073/pnas.0308668101. Epub 2004 May 12. Proc Natl Acad Sci U S A. 2004. PMID: 15141090 Free PMC article.
-
Efficient and Stable Delivery of Multiple Genes to Fish Cells by a Modified Recombinant Baculovirus System.Int J Mol Sci. 2018 Nov 27;19(12):3767. doi: 10.3390/ijms19123767. Int J Mol Sci. 2018. PMID: 30486430 Free PMC article.
-
Efficient detection, quantification and enrichment of subtle allelic alterations.DNA Res. 2012 Oct;19(5):423-33. doi: 10.1093/dnares/dss023. DNA Res. 2012. PMID: 23075543 Free PMC article.
References
Publication types
MeSH terms
LinkOut - more resources
Full Text Sources
Other Literature Sources
Medical
Research Materials

