

Genetic dissection of functional contributions of specific potassium channel subunits in habituation of an escape circuit in Drosophila
- PMID: 9482810
- PMCID: PMC6792913
- DOI: 10.1523/JNEUROSCI.18-06-02254.1998
Genetic dissection of functional contributions of specific potassium channel subunits in habituation of an escape circuit in Drosophila
Abstract
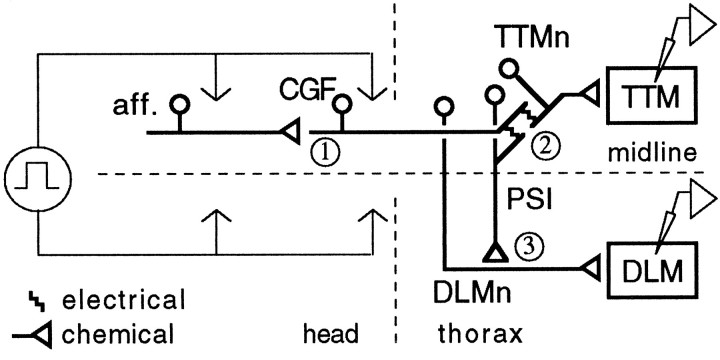
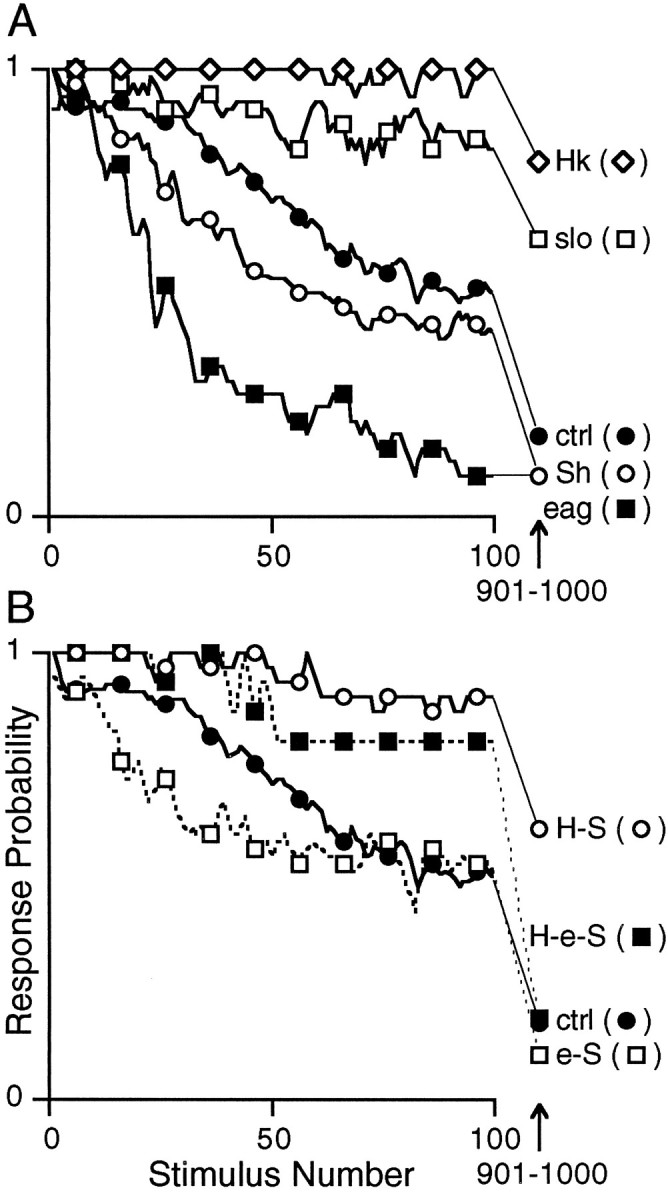
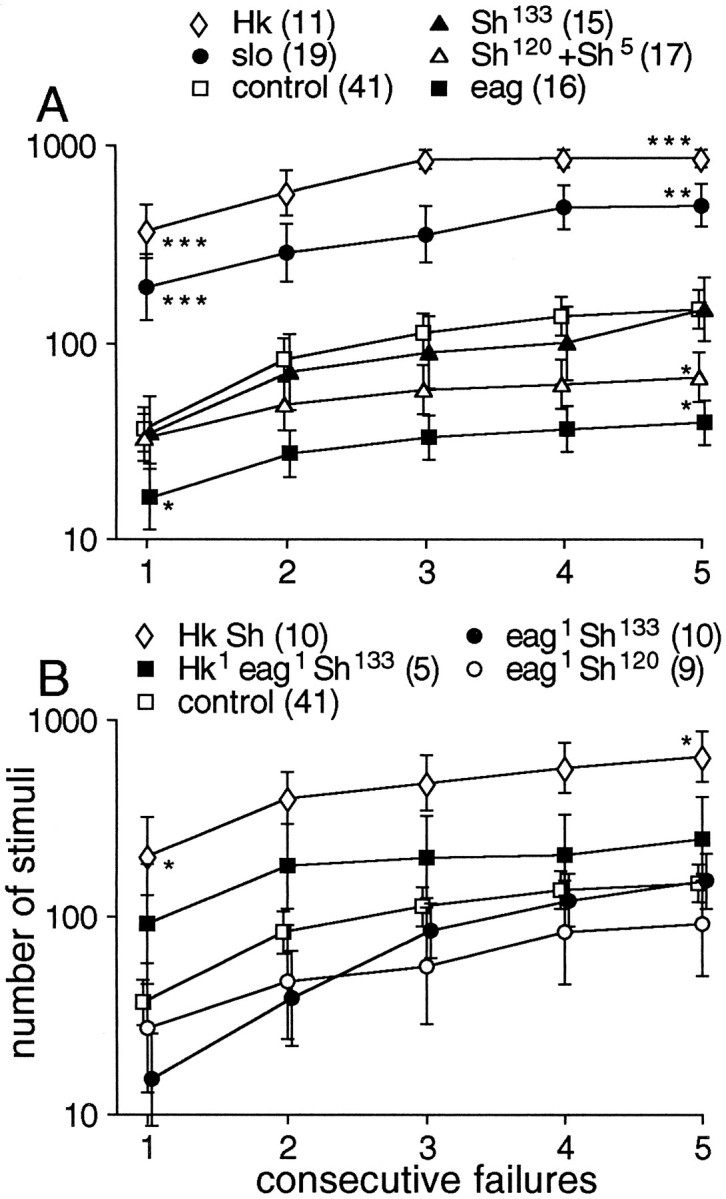
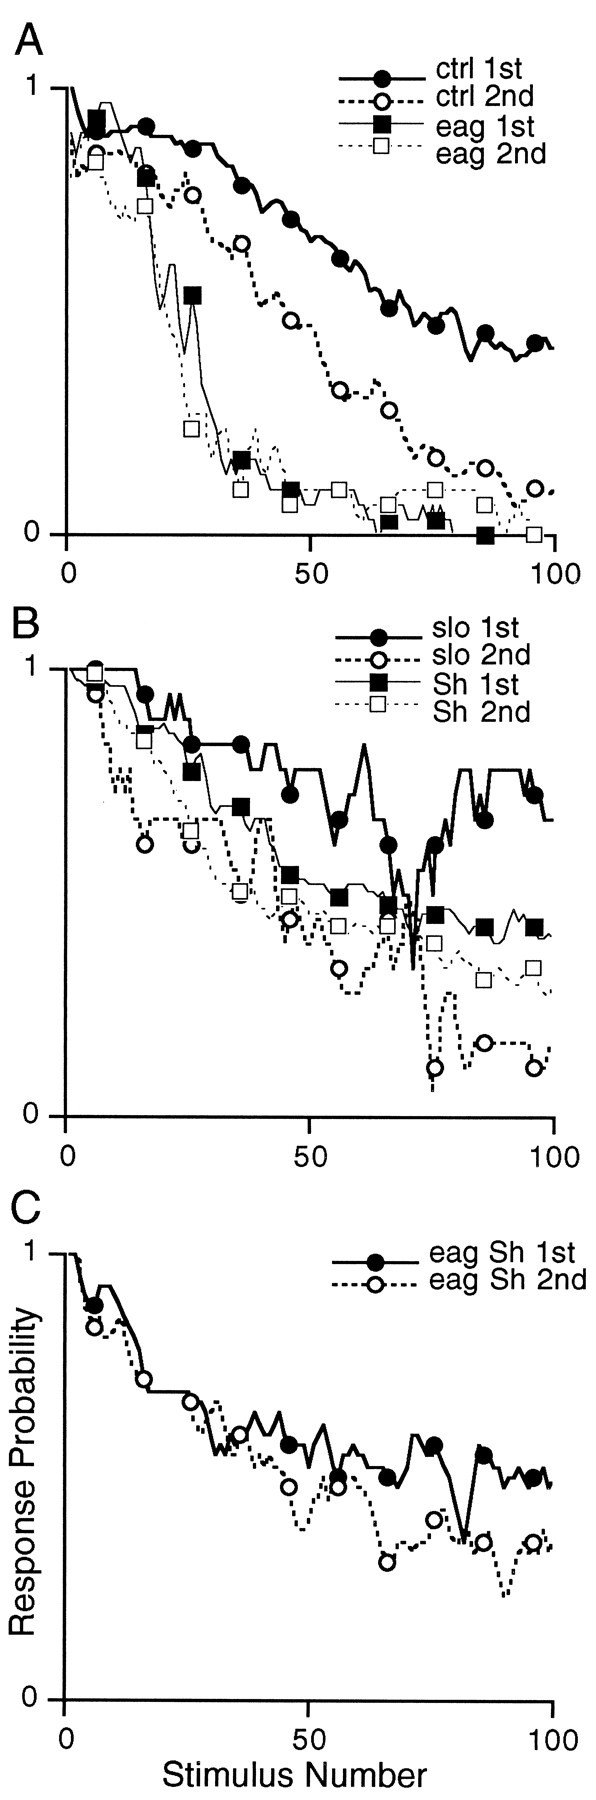
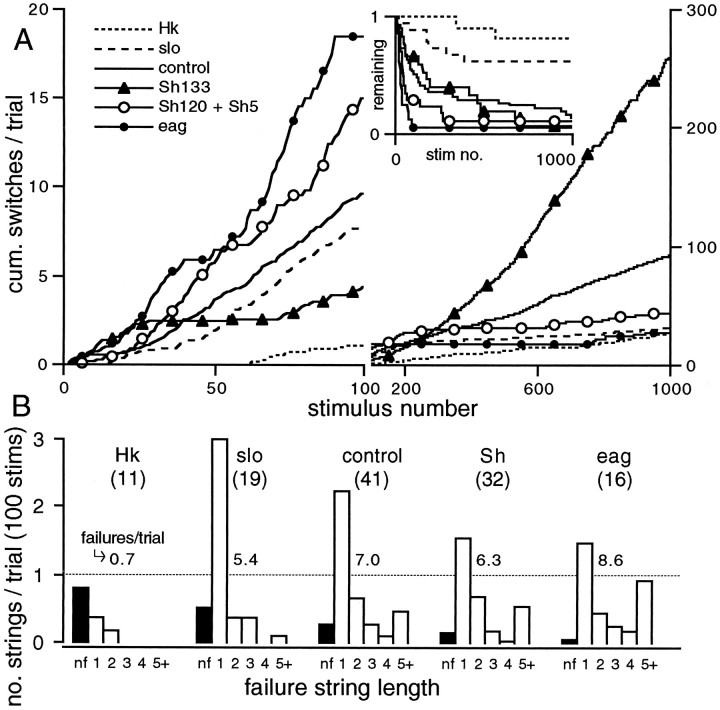
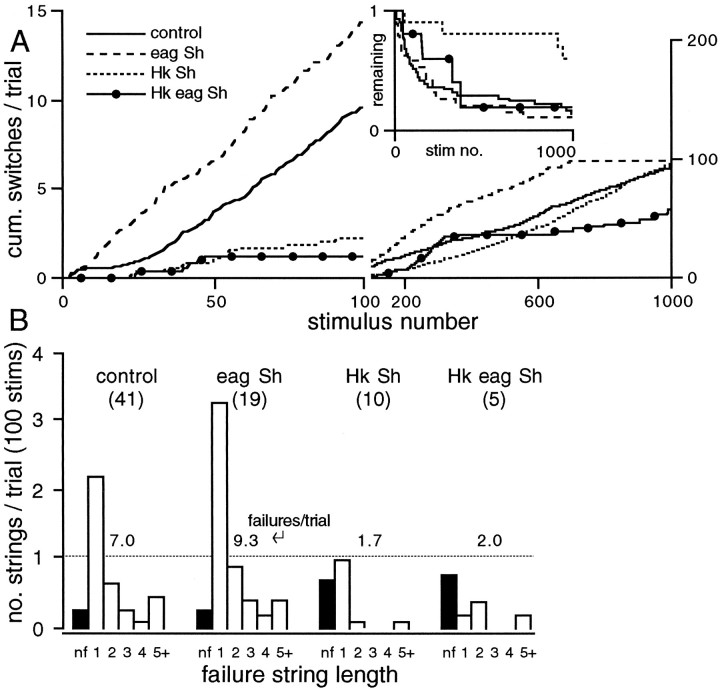
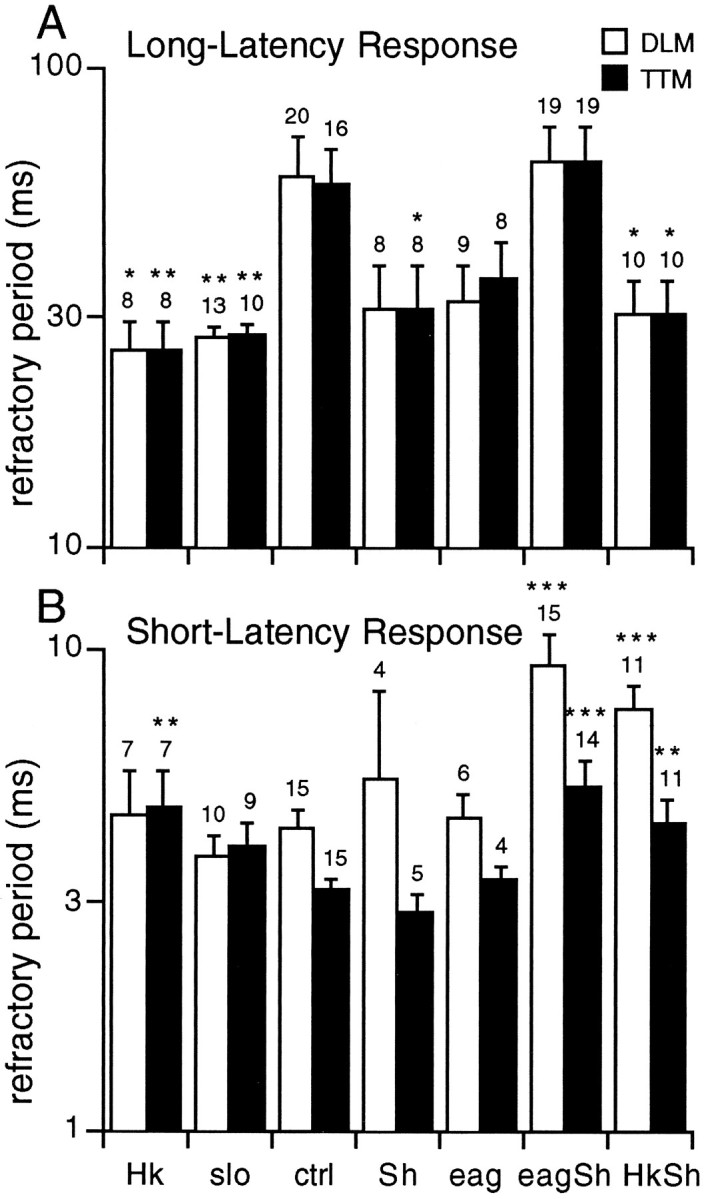
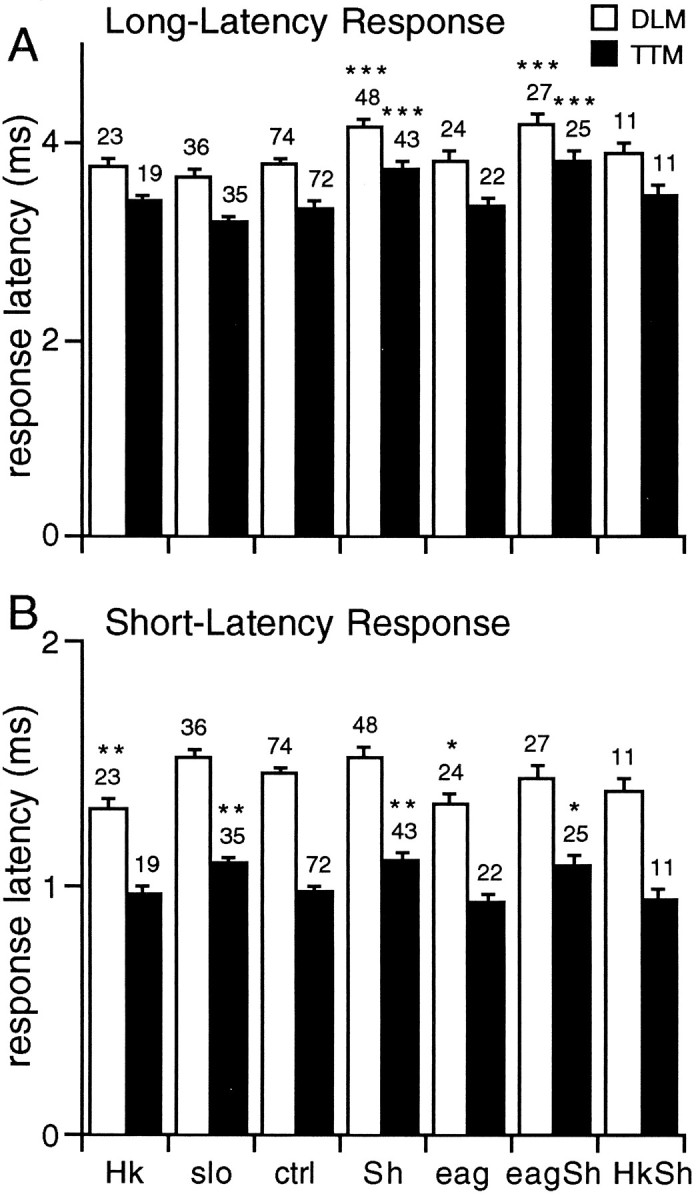
Potassium channels have been implicated in central roles in activity-dependent neural plasticity. The giant fiber escape pathway of Drosophila has been established as a model for analyzing habituation and its modification by memory mutations in an identified circuit. Several genes in Drosophila encoding K+ channel subunits have been characterized, permitting examination of the contributions of specific channel subunits to simple conditioning in an identified circuit that is amenable to genetic analysis. Our results show that mutations altering each of four K+ channel subunits (Sh, slo, eag, and Hk) have distinct effects on habituation at least as strong as those of dunce and rutabaga, memory mutants with defective cAMP metabolism (). Habituation, spontaneous recovery, and dishabituation of the electrically stimulated long-latency giant fiber pathway response were shown in each mutant type. Mutations of Sh (voltage-gated) and slo (Ca2+-gated) subunits enhanced and slowed habituation, respectively. However, mutations of eag and Hk subunits, which confer K+-current modulation, had even more extreme phenotypes, again enhancing and slowing habituation, respectively. In double mutants, Sh mutations moderated the strong phenotypes of eag and Hk, suggesting that their modulatory functions are best expressed in the presence of intact Sh subunits. Nonactivity-dependent responses (refractory period and latency) at two stages of the circuit were altered only in some mutants and do not account for modifications of habituation. Furthermore, failures of the long-latency response during habituation, which normally occur in labile connections in the brain, could be induced in the thoracic circuit stage in Hk mutants. Our work indicates that different K+ channel subunits play distinct roles in activity-dependent neural plasticity and thus can be incorporated along with second messenger "memory" loci to enrich the genetic analysis of learning and memory.
Figures


Similar articles
-
Altered habituation of an identified escape circuit in Drosophila memory mutants.J Neurosci. 1996 May 15;16(10):3486-99. doi: 10.1523/JNEUROSCI.16-10-03486.1996. J Neurosci. 1996. PMID: 8627381 Free PMC article.
-
A cGMP-dependent protein kinase gene, foraging, modifies habituation-like response decrement of the giant fiber escape circuit in Drosophila.Learn Mem. 2000 Sep-Oct;7(5):341-52. doi: 10.1101/lm.31600. Learn Mem. 2000. PMID: 11040266 Free PMC article.
-
Effects of mutant Drosophila K+ channel subunits on habituation of the olfactory jump response.J Neurogenet. 2007 Jan-Jun;21(1-2):45-58. doi: 10.1080/01677060701247375. J Neurogenet. 2007. PMID: 17464797 Free PMC article.
-
Neurogenetic approaches to habituation and dishabituation in Drosophila.Neurobiol Learn Mem. 2009 Sep;92(2):166-75. doi: 10.1016/j.nlm.2008.08.003. Epub 2008 Oct 2. Neurobiol Learn Mem. 2009. PMID: 18765288 Free PMC article. Review.
-
Co-assembly of potassium channel subunits in Drosophila: the combinatorial hypothesis revisited.Chin J Physiol. 1995;38(3):131-8. Chin J Physiol. 1995. PMID: 8846721 Review.
Cited by
-
Habituation of reflexive and motivated behavior in mice with deficient BK channel function.Front Integr Neurosci. 2013 Nov 19;7:79. doi: 10.3389/fnint.2013.00079. eCollection 2013. Front Integr Neurosci. 2013. PMID: 24312024 Free PMC article.
-
The role of synaptic ion channels in synaptic plasticity.EMBO Rep. 2006 Nov;7(11):1104-10. doi: 10.1038/sj.embor.7400830. EMBO Rep. 2006. PMID: 17077866 Free PMC article. Review.
-
A novel role for ecdysone in Drosophila conditioned behavior: linking GPCR-mediated non-canonical steroid action to cAMP signaling in the adult brain.PLoS Genet. 2013;9(10):e1003843. doi: 10.1371/journal.pgen.1003843. Epub 2013 Oct 10. PLoS Genet. 2013. PMID: 24130506 Free PMC article.
-
Constitutive activation of Ca2+/calmodulin-dependent protein kinase II during development impairs central cholinergic transmission in a circuit underlying escape behavior in Drosophila.J Neurosci. 2012 Jan 4;32(1):170-82. doi: 10.1523/JNEUROSCI.6583-10.2012. J Neurosci. 2012. PMID: 22219280 Free PMC article.
-
Distinct Aging-Vulnerable and -Resilient Trajectories of Specific Motor Circuit Functions in Oxidation- and Temperature-Stressed Drosophila.eNeuro. 2022 Jan 19;9(1):ENEURO.0443-21.2021. doi: 10.1523/ENEURO.0443-21.2021. Print 2022 Jan-Feb. eNeuro. 2022. PMID: 34876473 Free PMC article.
References
-
- Alkon DL. Biophysics of memory. In: Colatsky TJ, editor. Potassium channels: basic function and therapeutic aspects. Liss; New York: 1990. pp. 273–277.
-
- Atkinson NS, Robertson GA, Ganetzky B. A component of calcium-activated potassium channels encoded by the Drosophila slo locus. Science. 1991;253:551–554. - PubMed
-
- Baro DJ, Levini RM, Kim MT, Willms AR, Lanning CC, Rodriguez HE, Harris-Warrick RM. Quantitative single-cell-reverse transcription-PCR demonstrates that A-current magnitude varies as a linear function of shal gene expression in identified stomatogastric neurons. J Neurosci. 1997;17:6597–6610. - PMC - PubMed
Publication types
MeSH terms
Substances
Grants and funding
LinkOut - more resources
Full Text Sources
Molecular Biology Databases
Miscellaneous